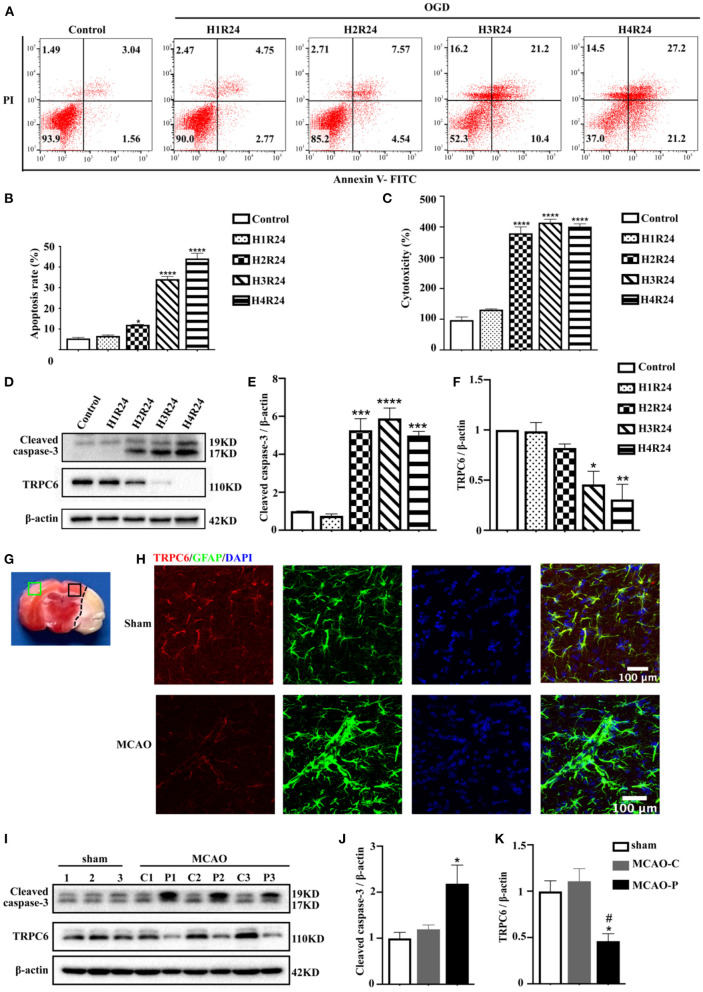
Figure 2.
TRPC6 in the cortical astrocytes is downregulated in ischemia. (A) Cultured astrocytes were exposed or not to OGD/R, and their apoptosis and death was detected by FITC/PI flow cytometry analysis. The percentage of apoptosis in scatter plots was presented as the proportion of apoptotic cells vs. total cell population (H1R24: 1 h OGD followed by 24 h reperfusion; H2R24: 2 h OGD followed by 24 h reperfusion; H3R24: 3 h OGD followed by 24 h reperfusion; H4R24: 4 h OGD followed by 24 h reperfusion). (B) Bar chart showed the statistical results of apoptosis rate measured by flow cytometry in each group in three independent experiments. Data were shown as mean ± SEM (n = 3). (C) LDH assay was used to measure the cytotoxicity of astrocytes in control and OGD groups. Data were shown as mean ± SEM (n = 4). (D) The protein level of TRPC6 and cleaved caspase-3 in astrocytes were tested by western blot analysis. β-actin was used as a loading control. (E,F) Quantifications of cleaved caspase-3 and TRPC6 protein levels shown in (D). Data were shown as mean ± SEM (n = 3). (G) Brain slices with TTC staining. Green rectangle: contralateral cortex; Black rectangle: peri-infarct cortex. (H) Representative images of the cortex after sham or MCAO operation (peri-infarct cortex) double-stained with the TRPC6 (Red) and GFAP (Green) antibodies (Scar bar: 100 μm; 600× magnification). (I) Mice were exposed to sham operation or MCAO procedure (n = 3). The expressions of TRPC6 and cleaved caspase-3 in sham group (left hemisphere) and in contralateral (C) or peri-infarct (P) cortex were detected by western blotting. β-actin was used as a loading control. The number “1,” “2,” “3” represents cortices in each group were extracted form three different mice. (J,K) Quantifications of cleaved caspase-3 and TRPC6 protein levels shown in (I). Data were shown as mean ± SEM (n = 3). MCAO-C, contralateral cortices in MCAO mice; MCAO-P, peri-infarct cortices in MCAO mice. *p < 0.05, **p < 0.01, ***p < 0.001, ****p < 0.0001 (all comparisons to control group or sham group). #p < 0.05 (comparisons to MCAO-C group).

