Figure 1.
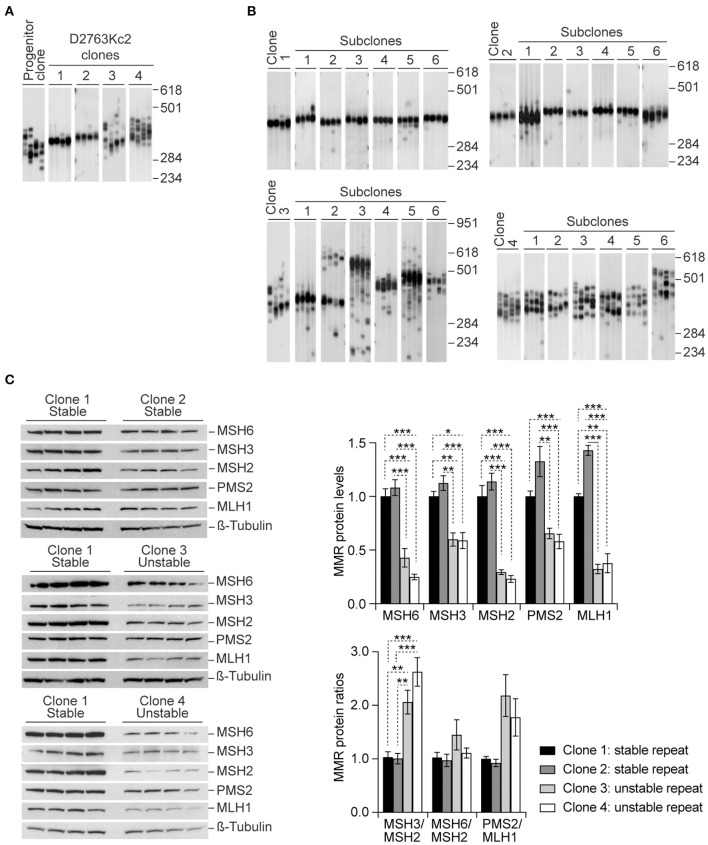
Higher CAG•CTG repeat size variability is associated with higher MSH3/MSH2 protein ratios in homogenous single cell clones. (A) Representative SP-PCR analyses of the expanded CAG•CTG trinucleotide repeat in D2763Kc2 cell clones. Single-cell clones were derived from the progenitor culture by limiting dilution and grown for 20 population doublings (~20 to 40 days). (B) Representative SP-PCRs of the expanded CAG•CTG repeat in sub-clones derived from four selected D2763Kc2 clones showing different repeat dynamics. For clarity, only six representative sub-clonal cultures are shown. The scale on the right indicates the DNA molecular weight markers converted into number of CAG•CTG repeats. (C) Quantification of MMR protein levels in selected D2763Kc2 clones. Independent single cell clones were established from the same progenitor culture. Four clones were selected for analysis. Four protein lysates were collected from each clone, electroblotted and probed with anti-MMR proteins. ß-Tubulin was used as loading control. The top graph shows the average protein levels relative to normalized control clone 1. The bottom graph shows the average MMR protein ratios relative to normalized control clone 1. The error bars indicate ± SEM. Statistically significant changes are indicated (*p < 0.05, **p < 0.01, ***p < 0.0015; Two-way ANOVA, Tukey post-hoc correction for multiple comparisons).

