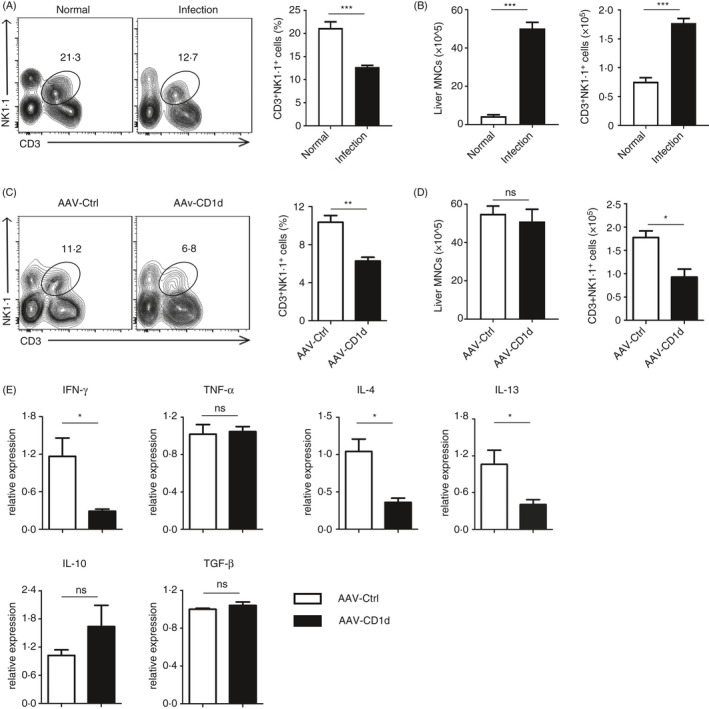
Figure 4.

NKT cells are decreased in CD1d‐overexpressing liver of S. japonicum‐infected mice. (A) Representative FCM dot plots and average percentages of CD3+NK1.1+ NKT cells from the liver of normal or S. japonicum‐infected mice. (B) The bar graphs show the absolute numbers of liver MNCs (left) and CD3+NK1.1+ NKT cells (right)in the liver from mice in (A). (C) Representative FCM dot plots and average percentages of CD3+NK1.1+ NKT cells from the liver of S. japonicum‐infected mice injected with AAV‐CD1d or AAV‐Ctrl. (D) The bar graphs show the absolute numbers of liver MNCs (left) and CD3+NK1.1+ NKT cells (right) in the liver from mice in (C). (E) Relative mRNA expression levels of IFN‐γ, TNF‐α, IL‐4, IL‐13, IL‐10 and TGF‐β in livers from S. japonicum‐infected mice injected with AAV‐CD1d or AAV‐Ctrl. Data are means ±SD from 5 mice per group and representative of two independent experiments. *P < 0.05, **P < 0.01 and ***P < 0.001; ns, not significant.
