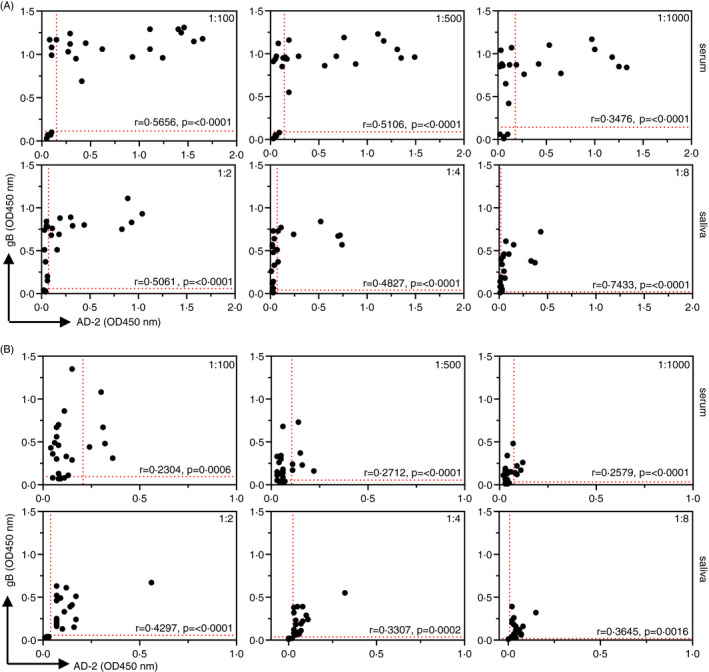
Figure 2.

Scatterplot correlations of individual samples displaying IgG and IgA binding to both HCMV gB and the AD‐2 epitope. ELISA data displaying comparative IgG (A) and IgA (B) binding to gB and AD‐2 epitope of HCMV in each sample of human serum (n = 24) and human saliva (n = 24). Samples were diluted as indicated, and data are represented as OD450 nm values of triplicate determinations of three independent experiments. Horizontal and vertical dotted lines representing positive/negative cut‐off values for negative gB and negative AD‐2 samples, respectively, were based on IgG gB‐negative samples (n = 4). Correlation coefficients (Spearman's) and statistical significance for each set of determinations comparing serum or saliva IgG and IgA binding to gB and AD‐2 epitope are displayed within each graph
