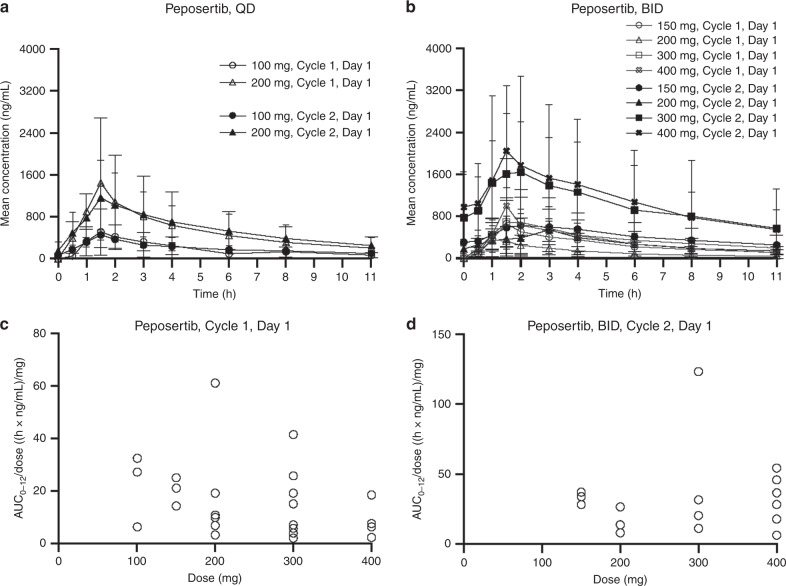
Fig. 2. Peposertib (formerly M3814) pharmacokinetics.
Plasma concentration–time profiles of peposertib (formerly M3814) following a QD (PK Analysis Set; n = 6) and b BID (PK Analysis Set; n = 25 [Cycle 1], n = 17 [Cycle 2]) dosing (linear scale). Dose-normalised AUC0–12 for peposertib by dose on c Cycle 1 Day 1 (QD and BID; PK Analysis Set; n = 25) and d Cycle 2 Day 1 (BID; PK Analysis Set; n = 17). AUC0–12 area under the plasma concentration–time curve from 0 to 12 h, BID twice daily, PK pharmacokinetics, QD once daily.

