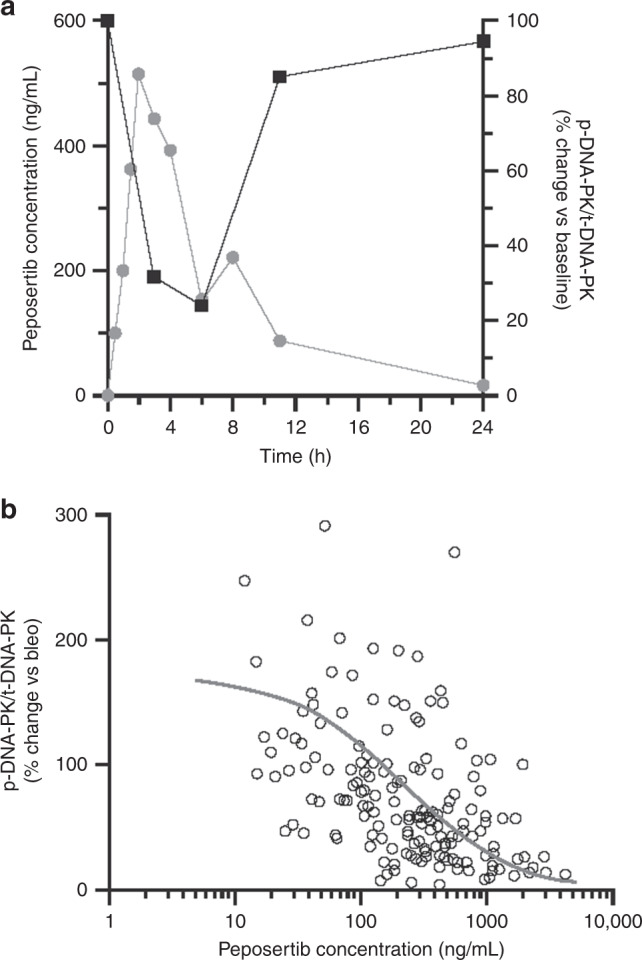
Fig. 3. DNA-PK inhibition by peposertib (formerly M3814).

In a typical time-course profiles of PK (grey circles) and DNA-PK inhibition (black squares) after peposertib treatment from one patient treated with peposertib 100 mg QD. DNA-PK inhibition on treatment is expressed as percentage change of p-DNA-PK/t-DNA-PK from the pre-treatment value (time h = 0). In b concentration-dependent inhibition of DNA-PK in response to peposertib treatment. Experimental concentration−response data are shown (open circles) and the line represents the Emax model fit to the data. Bleo bleomycin, DNA-PK DNA-dependent protein kinase, Emax maximum response, p-DNA-PK autophosphorylated form of DNA-PK on Ser2056, PK pharmacokinetics, QD once daily, t-DNA-PK total DNA-PK.
