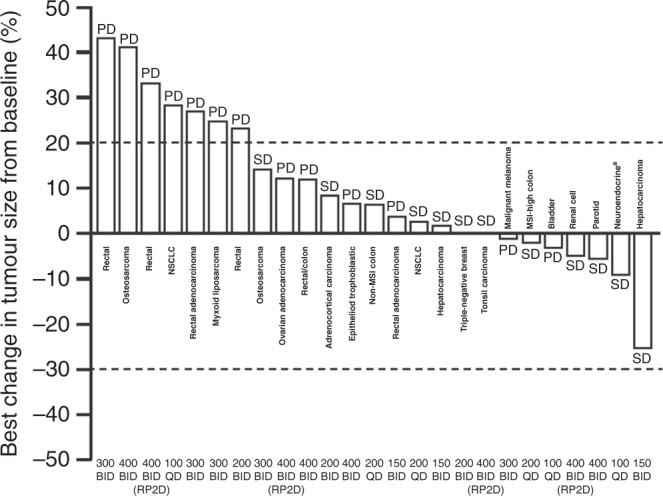
Fig. 4. Waterfall plot showing best percentage change in tumour size from baseline and best overall response.

Peposertib (formerly M3814) dose (mg)/frequency of administration is shown for each patient on the x axis. Dashed lines show the 20% threshold for PD and the 30% threshold for partial response. aColon. BID twice daily, MSI microsatellite instability, NSCLC non-small cell lung cancer, PD progressive disease, QD once daily, RP2D recommended phase 2 dose, SD stable disease.
