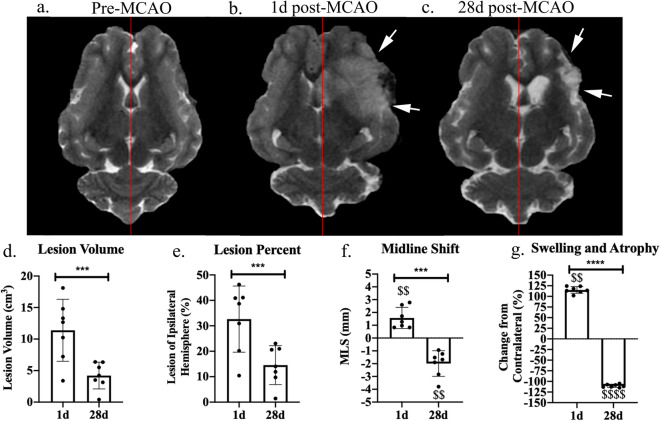
Figure 1.
Canonical MRI measurements of MCAO induced ischemic stroke at 1d and 28d post-MCAO. T2W images prior to MCAO reveal homology between the hemispheres (a). At 1d (b) and 28d (c) post-MCAO, T2W images exhibited territorial hyperintense lesions indicated by white arrows and a shift from the natural midline (red lines indicate natural midline). Lesion volume (d), lesion volume as a percent of the ipsilateral hemisphere (e), midline shift (MLS) (f), and hemispheric changes (g) were quantified at 1d and 28d post-MCAO. *** and **** indicated statistically different between timepoints. $$ and $$$$ indicated statistically different from hypothetical normal.

