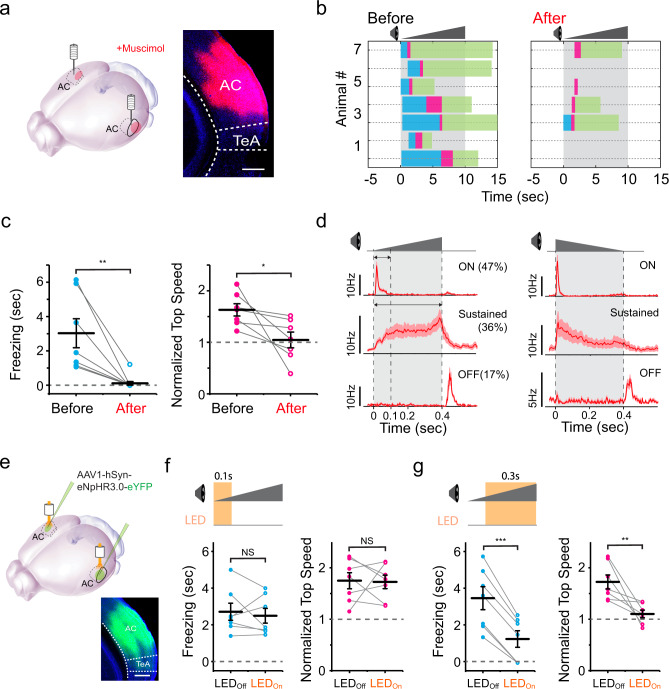
Fig. 2. Crescendo-induced defensive behaviors require activity of auditory cortex (AC).
a Silencing AC with muscimol. Right, example image showing the spread of fluorescent muscimol in AC. Scale bar, 500 µm. TeA, temporal association cortex. b Crescendo-induced behavioral responses of seven mice two days before (left) and right after (right) silencing AC. c Comparison of crescendo-induced freezing duration (left, **p = 0.010, two-sided paired t test, t = 3.684) and normalized top speed (right, *p = 0.038, two-sided paired t test, t = 2.652) before and after silencing AC. Data points for the same animal are connected with a line (n = 7). Data are presented as mean ± s.e.m. The center presents the mean value and the bar represents s.e.m. d Population average of peri-stimulus spike time histograms (PSTHs) for AC layer 5 neurons exhibiting On, sustained and Off responses respectively (n = 25, 21, 10 cells) to the crescendo (left) and decrescendo (right) stimulus. e, Injection of AAV-hSyn-eNpHR3.0 in AC. Bottom, example image showing the expression of eNpHR3.0 in AC. Scale bar, 500 µm. f, Behavioral responses to crescendo stimuli without (LEDoff) and with (LEDon) optogenetic inhibition of AC activity during 0-100 ms of each stimulus. Data points for the same animal are connected with a line (n = 7 mice). Left, p = 0.59, two-sided paired t test, t = 0.568; right, p = 0.90, t = 0.126. N.S., non-significant. g Behavioral responses to crescendo stimuli without (LEDoff) and with (LEDon) optogenetic inhibition of AC activity during 100-400 ms of each stimulus (n = 7 mice). Left, ***p = 2.281 × 10⁻⁵, two-sided paired t test, t = 10.42; right, **p = 0.007, t = 3.420. Data are presented as mean ± s.e.m. for (f–g). The center presents the mean value and the bar represents s.e.m.

