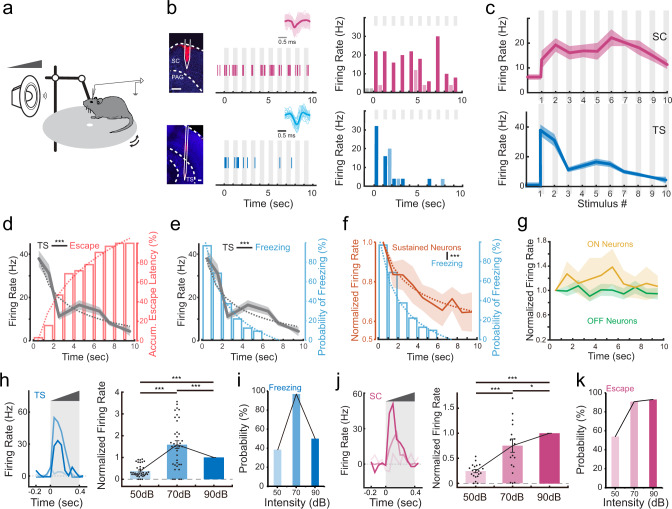
Fig. 5. Differential temporal dynamics of superior colliculus (SC) and the tail of the striatum (TS) neuron responses to crescendo stimuli.
a Illustration of in vivo recording in the awake head-fixed condition. b Left, example image showing track of the recording electrode in SC (top) or TS (bottom). Scale bars, 200 µm. Middle, example single-unit response to a train of crescendo stimuli in SC (top) or TS (bottom). Each vertical line represents one spike. Grey column labels the duration of a sound stimulus. Superimposed individual spike waveforms and the average are shown in top insets (SC, n = 104 spikes; TS, n = 22 spikes). Right, corresponding PSTH. Dark and light-shaded colors represent spike rates during a sound stimulus (marked by grey column) and inter-stimulus intervals respectively. PAG periaqueductal gray. c Population average of evoked firing rate (analyzed for the duration of each individual stimulus) across10 crescendo stimuli (n = 46 and 55 for SC and TS neurons respectively). Shade indicates s.e.m. d Comparison of the mean evoked firing rate of TS neurons across 10 stimuli and accumulative distribution of escape latencies. Dotted curve represents fitting of the data. ***p < 0.001, r = −0.92, Pearson’s correlation coefficient. e Comparison of the mean evoked firing rate of TS neurons across 10 stimuli and the probability of freezing over time. ***p < 0.001, r = 0.92, Pearson’s correlation coefficient. f Comparison of the mean evoked firing of the sustained type of cortical L5 neurons and the probability of freezing over time. ***p < 0.001, r = 0.95, Pearson’s correlation coefficient. g Comparison of the mean evoked firing of the ON (yellow) and OFF (green) type of cortical neurons across 10 stimuli. ON neuron response vs. probability of freezing, p = 0.58, r = 0.20; OFF neuron response vs. probability of freezing, p = 0.74, r = −0.12, Pearson’s correlation coefficient. h, Evoked firing rate of an example TS neuron (left) and normalized responses of all the recorded TS neurons (right) to crescendo stimuli with different top intensities. Right, ***p < 0.001, one-way ANOVA with post hoc (Bonferroni) test, n = 36. i The probability of freezing to crescendo stimuli with different top intensities (n = 13, 32 and 14 mice respectively). j Evoked firing rate of an example SC neuron (left) and normalized responses of all the recorded SC neurons (right) to crescendo stimuli with different top intensities. Right, ***p < 0.001, *p = 0.022, one-way ANOVA with post hoc (Bonferroni) test, n = 19. k The probability of escape to crescendo stimuli with different top intensities (n = 13, 32 and 14 mice respectively).

