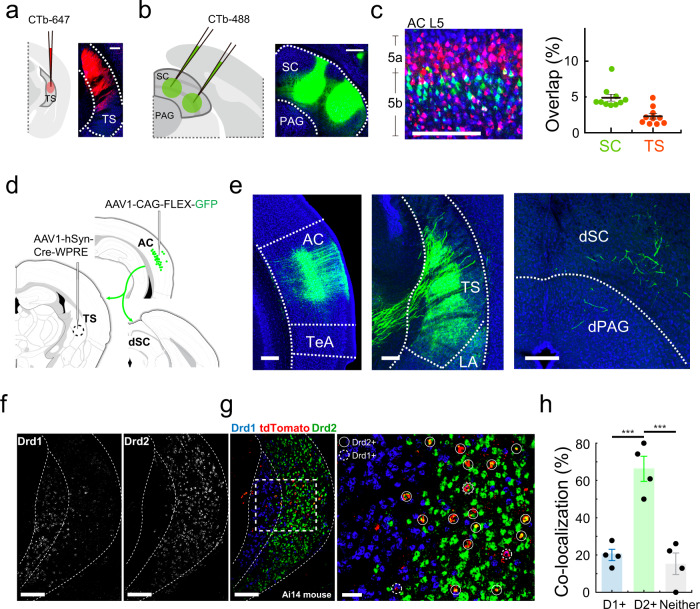
Fig. 6. SC- and TS- projecting corticofugal neurons and targets.
a Injection of CTb-647 (red) into TS. Scale, 200 µm. TS the tail of the striatum. b Injection of CTb-488 (green) in SC in the same animal. Scale, 200 µm. SC superior colliculus, PAG periaqueductal gray. c Left, retrogradely labeled TS-projecting (red) and SC-projecting (green) neurons in layer 5 (L5) of auditory cortex (AC). Scale bars, 200 µm. Right, overlap between the two groups of projecting neurons (overlap ratio: 4.9 ± 0.5% in SC-projecting neurons. 2.3 ± 0.4% in TS-projecting neurons, n = 10 sections). Data are presented as mean ± s.e.m. The center presents the mean value and the bar represents s.e.m. d Viral injections in TS and AC to label TS-projecting AC neurons. e Retrogradely labeled TS-projecting neurons in AC (left) and their axon terminals in TS (middle) and SC (right). Scale bars, 200 µm. TeA temporal association cortex, LA lateral amygdala, dSC deep layers of the superior colliculus, dPAG dorsal periaqueductal gray. The result was consistent in three mice. f Distribution of Drd1+ (left) and Drd2+ (right) neurons in TS. Scale bars, 200 µm. g AC-receipt neurons (tdTomato, red) and Drd1+ (blue) or Drd2+ (green) neurons in TS. Scale bars, 200 (left) and 50 (right) µm. h Percentage of AC-receipt neurons overlapping with D1+(i.e. Drd1+) neurons, D2+ (i.e. Drd2+) neurons or neither. D1+vs. D2+, ***p = 5.875 × 10⁻⁴; D2+vs. Neither, ***p = 2.827 × 10⁻⁴, one-way ANOVA with post hoc (Bonferroni) test, n = 4 sections. Data are presented as mean ± s.e.m. The center presents the mean value and the bar represents s.e.m.

