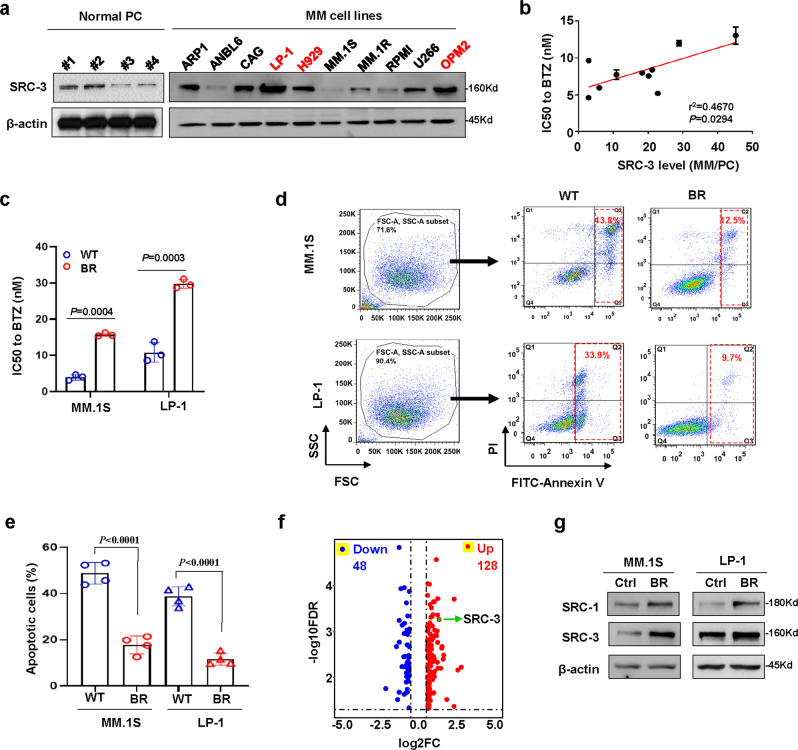
Fig. 2. SRC-3 enhances drug resistance to proteasome inhibitor in myeloma cells.
a Representative images (n = 3 biologically independent experiments) of Western blotting show SRC-3 levels in myeloma cell lines (n = 10) and plasma cells (PC, n = 4) from healthy controls. Red, cytogenetic t(4;14) cells. b Correlation coefficient between the SRC-3 levels and IC50 in myeloma cells (n = 3 independent experiments from n = 10 cell lines). P values of mean ± s.d. were determined by Pearson Coefficient. c Alteration of IC50 in bortezomib (BTZ)-resistant (BR) MM.1S and LP-1 cells compared to the parental wild type (WT) cells (n = 3 biologically independent experiments). Two-sided P-values were determined by Student’s t test; mean ± s.d. d Representative gating strategy of flow cytometry and apoptosis assay of the wild type (WT) and bortezomib (BTZ)-resistant (BR) MM cells induced by 5 nM BTZ for 48 h, and (e) analyzes the difference between two groups (n = 4 biologically independent experiments). Two-sided P-values were determined by Student’s t test; mean ± s.d. f Shown are 48 downregulated and 128 upregulated proteins (cutoff, 1.5 folds) in the bortezomib (BTZ)-resistant (BR) MM.1S cells compared to the wild type (WT) cells detected by Stable isotope labeling with amino acids in cell culture (SILAC) assay. g Elevated SRC-3 in wild type control (Ctrl) and bortezomib (BTZ)-resistant (BR) MM.1S and LP-1 cells by Western blotting (n = 3 biologically independent experiments). Source data are provided as a Source Data file.

