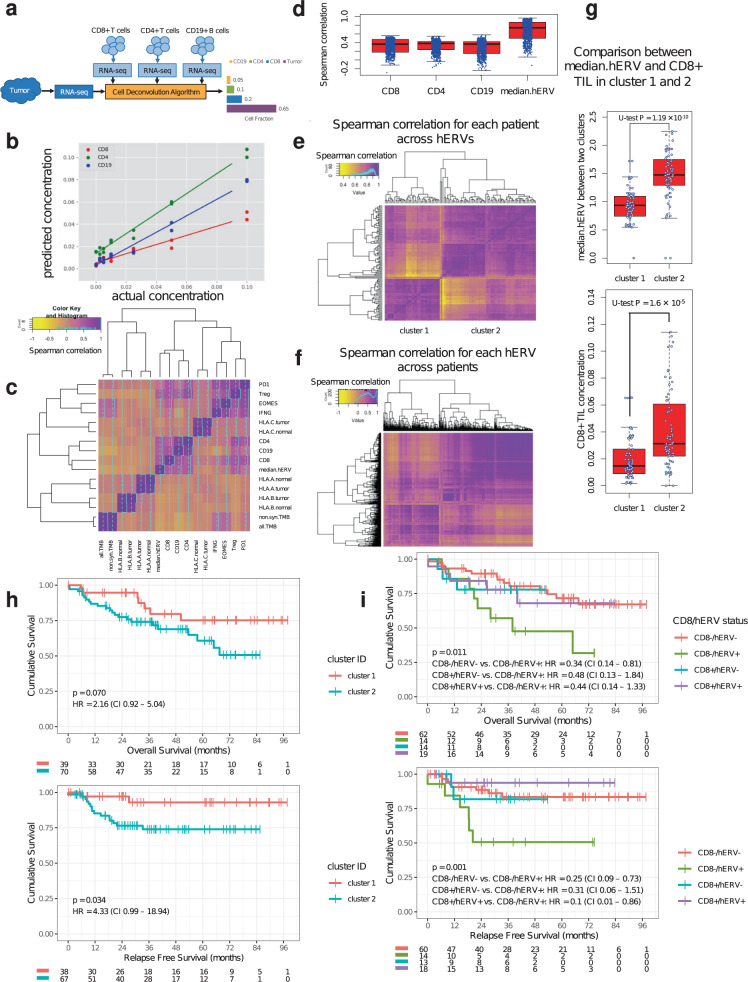
Fig. 1. Immune characteristic and prognostic power of hERVs in CRC.
a Schematic of immune cell deconvolution using FRICTION. b Immune cell input titration shows high accuracy of FRICTION in predicting CD8+, CD4+, and CD19+ immune cells using WTS data from fresh frozen tissues. c Heatmap illustrates the Spearman correlation between different immune related features. TILs are closely related to hERV expression demonstrating the immunogenicity of hERVs. High association between CD8+ T cells, Treg and PD1 indicates exhaustion CD8+ T cells in most patients. d Correlation of each individual hERVs transcripts with TILs and median.hERV. e Spearman correlation for each patient across hERVs. f Spearman correlation of hERVs across patients. g Two distinct classes of hERVs are associated with low and high median.hERV and CD8+ TIL. h Kaplan–Meyer curves of OS and RFS of patients stratified based on clusters obtained from hierarchical clustering in (e). cluster 1 (i.e. median.hERVlow) demonstrates a significantly better outcome compared to cluster 2 (i.e. median.hERVhigh). i Kaplan–Meier curves of OS and RFS for each group with respect to CD8 + and median.hERV status (log-rank P values are shown). The black lines in the “middle” of the boxes are the median values for each group. The vertical size of the boxes illustrates the interquartile range (IQR). Whiskers represent 1.5 IQR.

