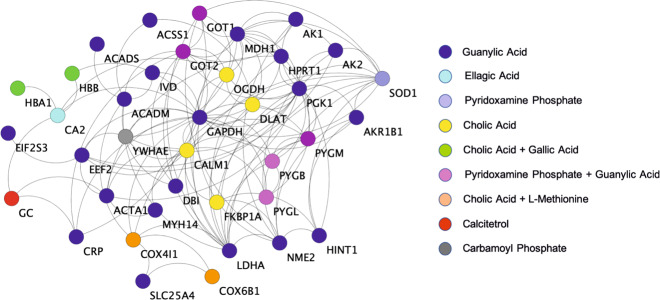
Fig. 4. Synergistic action of AR metabolites on target proteins.
The color codes on the proteins/targets in the interaction network indicate their corresponding metabolites identified after screening using SMSD and Tc. Blue circles represent the proteins corresponding to guanylic acid (the maximum in number), followed by yellow color for cholic acid. ellagic acid is represented by cyan color, whereas calciterol by red circles. Gray color circles correspond to carbamoyl phosphate and purple to pyridoxamine phosphate. Noradrenaline sulfate metabolite corresponds to light blue circled proteins. Few proteins correspond to more than one metabolite and are represented as orange circled proteins for the combination of cholic acid and L-methionine, and green circles for cholic acid and gallic acid. The pink circles are proteins corresponding to pyridoxamine phosphate and guanylic acid. All these proteins are interconnected and have a significant role in the disruption or regulation of pathways as seen when knocked out from the network. This observation suggests the co-dependency of AR metabolites for the maintenance of the protein–protein interaction network, which is vital to drug action, thereby affirming their synergistic action.

