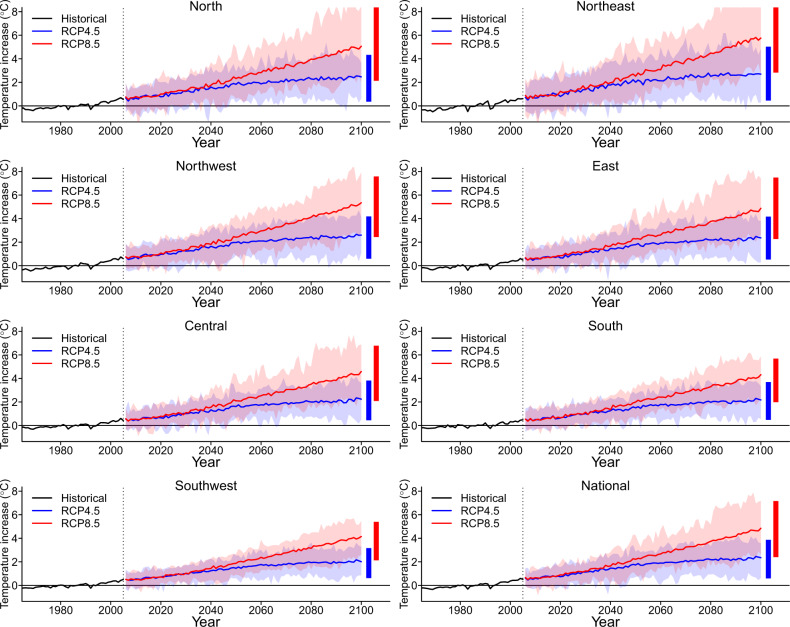
Fig. 2. Temporal trends in projected temperature in China.
RCP4.5 and RCP8.5 represent the low and high emission scenarios, respectively. Solid lines denote the mean annual temperature estimated across the 28 general circulation models. The shaded areas denote the temperature range for each year. The two vertical bars on the right show the average annual minimum and maximum for each projected temperature series. Source data are provided as Supplementary Data 2.

