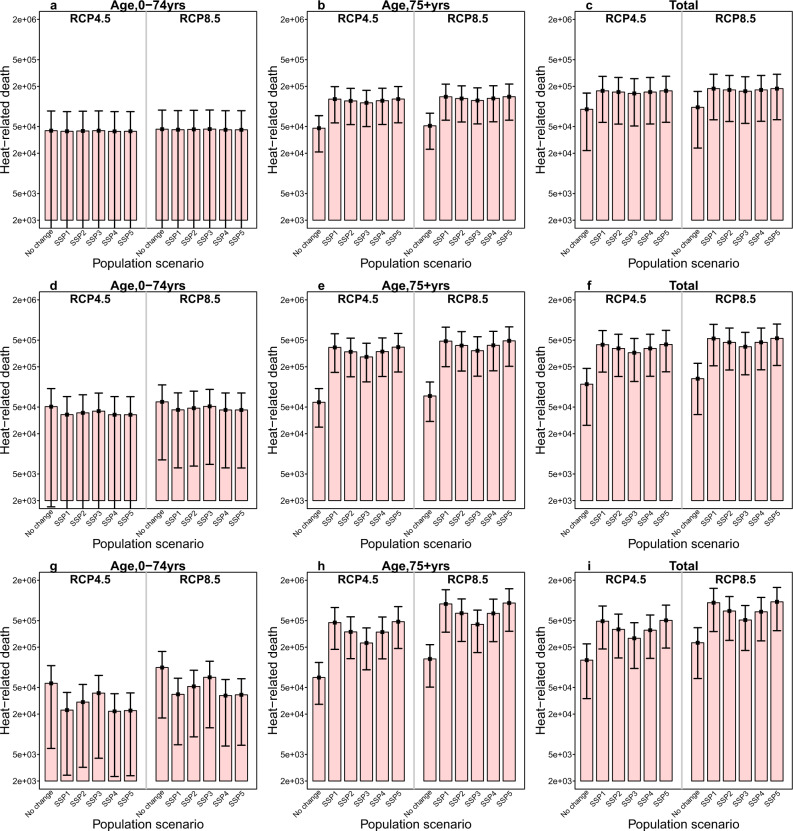
Fig. 4. The number of heat-attributable deaths by period, age, and population scenario in China.
a–c Respectively show the number of heat-attributable deaths (red bar) in the 2030 s for different age groups under six population scenarios (no change, SSP1–SSP5). d–f Respectively show the number of heat-attributable deaths in the 2050s by age and population scenario. g–i Respectively show the number of heat-attributable deaths in the 2050s by decade, age, and population scenario. The black vertical segments represent the 95% empirical confidence interval. A distributed lag nonlinear model was used for estimating district/county-specific temperature–mortality associations with 14 days of lag adjusted for time trends and day of the week, which were pooled in a multivariate meta-analysis. Then, based on the age-specific temperature–mortality association and age-specific projected population, estimates of the attributable number of deaths due to high temperature, defined as temperatures above the optimum temperature, were calculated for different age groups under the five SSPs. Monte Carlo simulations generating 1000 samples were computed to produce the empirical confidence interval. Source data are provided as Supplementary Data 4.

