Figure 1.
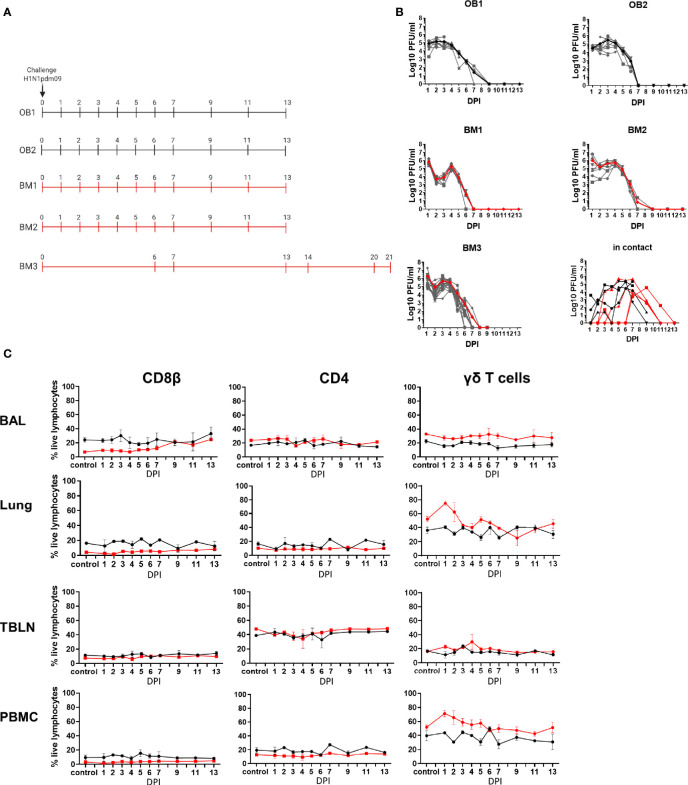
Experimental design, viral load and cell subset dynamics following H1N1 pmd09 infection. (A) Pigs were infected with H1N1pdm09 and culled on the days indicated. Two experiments with outbred (OB1 and OB2, black line) and two with inbred Babraham pigs (BM1 and BM2, red line) were performed. Two in-contact animals were included in each experiment one culled at day 11 and one at day 13 post infection. An extended time course of 21 days was performed with 18 inbred Babraham pigs (BM3, red line) with animals culled on the indicated days. (B) Virus load was determined by plaque assay of daily nasal swabs at the indicated time points. The thick line indicates the mean. (C) Proportions of CD4, CD8, and γδ T cells were determined by flow cytometry at the indicated time points.

