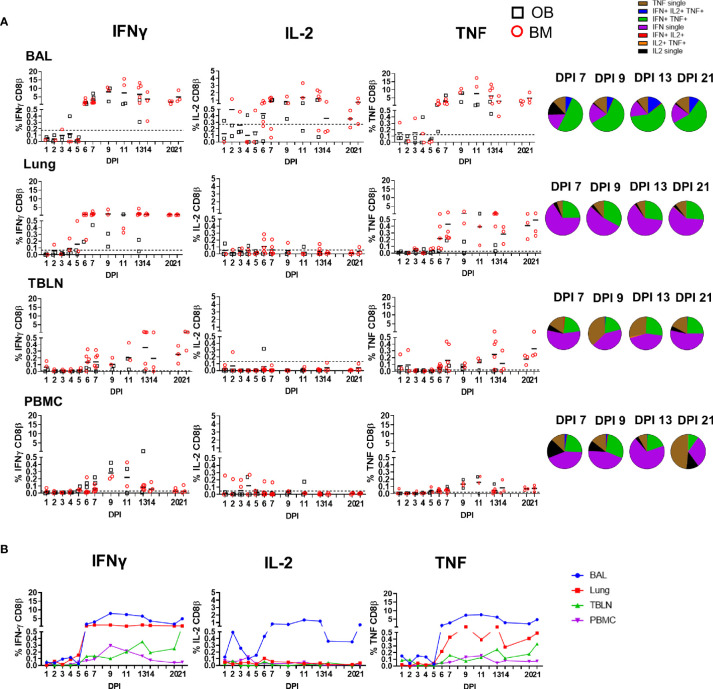
Figure 3.
CD8β T cell cytokine responses. (A) Cytokine response of CD8β T cells in outbred (black boxes) and inbred (red circles) pigs at each time point following influenza infection. BAL, lung, TBLN or PBMC cells were stimulated with H1N1pdm09 and cytokine secretion measured using intra-cytoplasmic staining. The mean of the 22 uninfected control animals is represented by a dotted line. DPI 1 to 7, 9, 11, and 13 each show results from 2 outbred and 2 inbred pigs. DPI 6, 7, 13, 14, 20, and 21 also include results from 3 additional inbred pigs. Pie charts show the proportion of single, double and triple cytokine-secreting CD8 T cells for IFNγ, TNF and IL-2 in outbred and inbred pigs at 7, 9, 13, and 21 DPI. (B) The mean percentages for IFNγ, TNF, and IL-2 in each tissue for both OB and BM together are shown over the time course.

