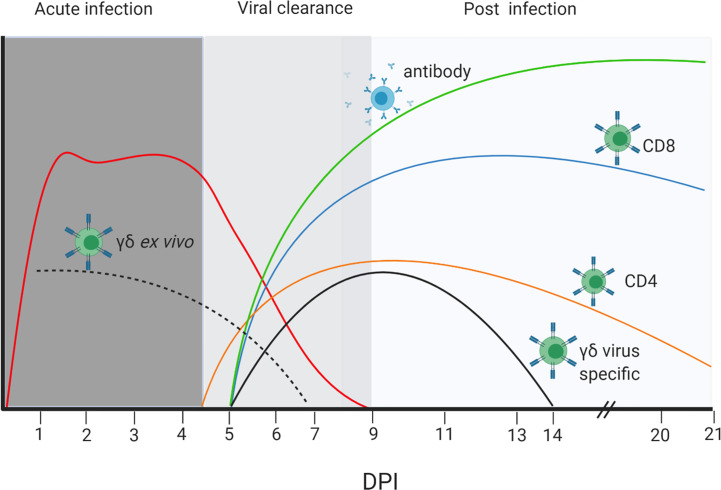
Figure 9.
Dynamics of viral load, T cell and Ab responses. Stylized presentation of kinetics and magnitude of viral load and immune responses. The different color lines represent the antibody and cellular responses as indicated, and the red line the virus load. The dotted black line represents ex vivo cytokine production by γδ T cells, while the solid black line is the cytokine production by γδ T cells re-stimulated with H1N1pdm09 virus in vitro. The magnitude of responses and virus load are represented on an arbitrary scale. The figure was created with BioRender.com.

