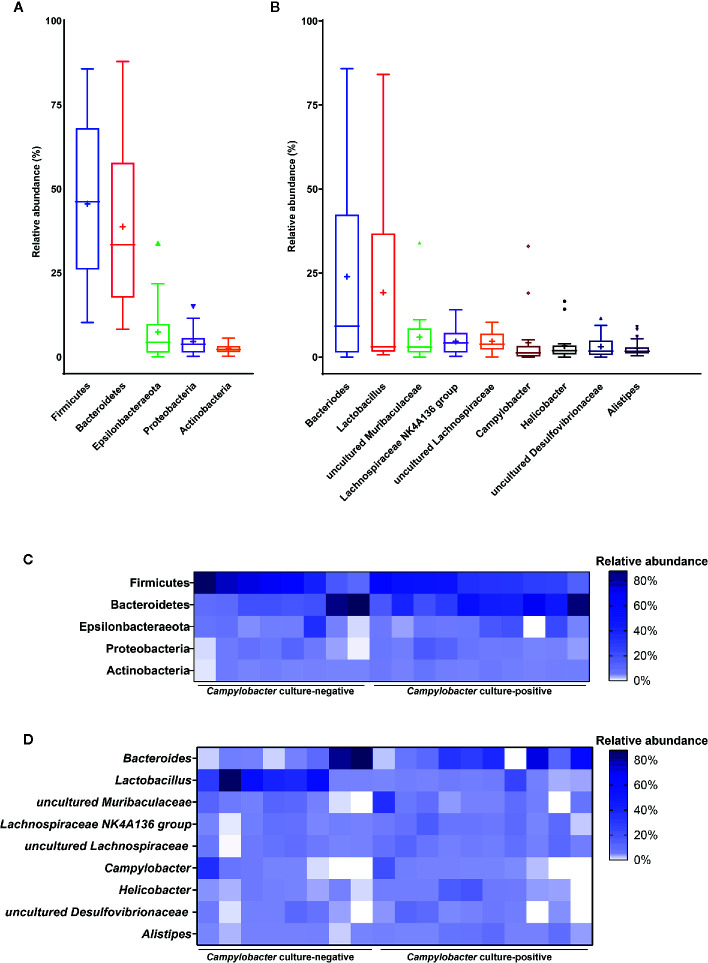
Figure 2.
Core gut microbiota of Micromys minutus. Box plots showing the relative abundance of the members of the core microbiota at the (A) phylum and (B) genus levels. Plus sign (+) represents the mean value. Heatmaps showing the relative abundance of core microbiota (C) at the phylum and (D) genus levels in individual M. minutus samples. The X-axis represents the individual samples of M. minutus. The Y-axis represents the core taxa. The color scale represents the relative abundance of core taxa in individual samples.

