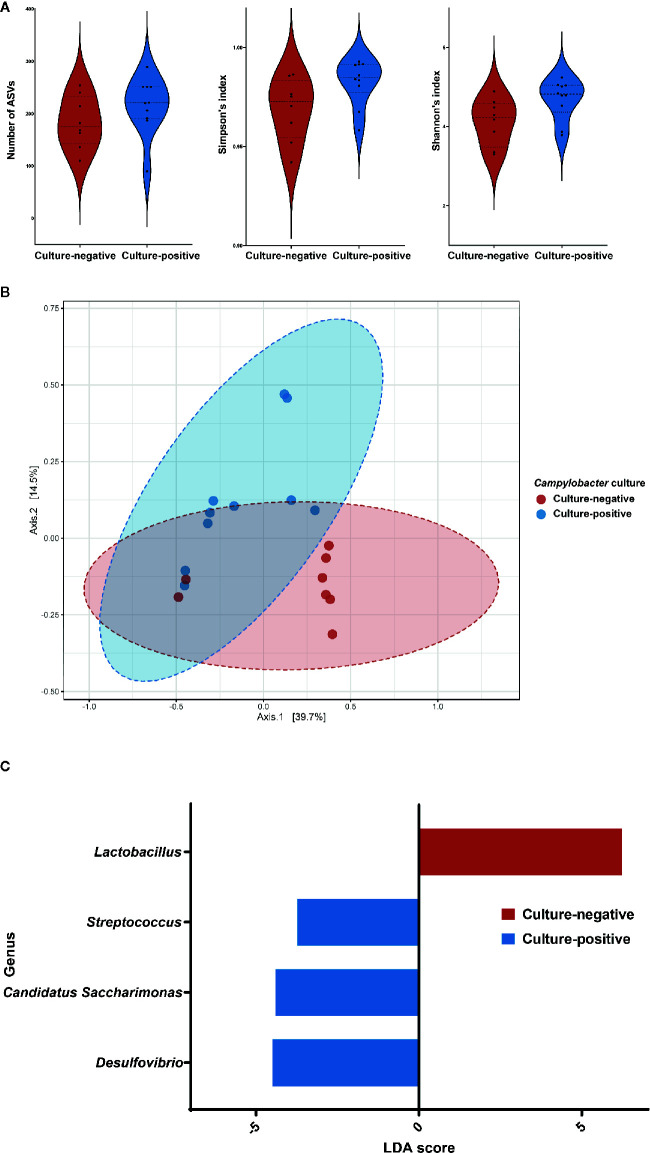
Figure 3.
Differences in the gut microbiota of Micromys minutus according to Campylobacter culture status. (A) Alpha diversity of the gut microbiota of two groups of Micromys minutus. The distribution of the number of observed amplicon sequence variants, the Simpson’s index and the Shannon’s index of each group is shown in the box plot. The blue box denotes the Campylobacter culture-positive group, and the red box denotes the Campylobacter culture-negative group. (B) Principle coordinate analysis plot of Bray-Curtis dissimilarity between the gut microbiota of the Campylobacter culture-negative and -positive groups of M. minutus. Ellipses indicate 95% confidence intervals. (C) Histograms of the linear discriminant analysis scores for genera with differential abundance identified using linear discriminant analysis effect size in a culture-positive (blue) and culture-negative (red) group of Micromys minutus.

