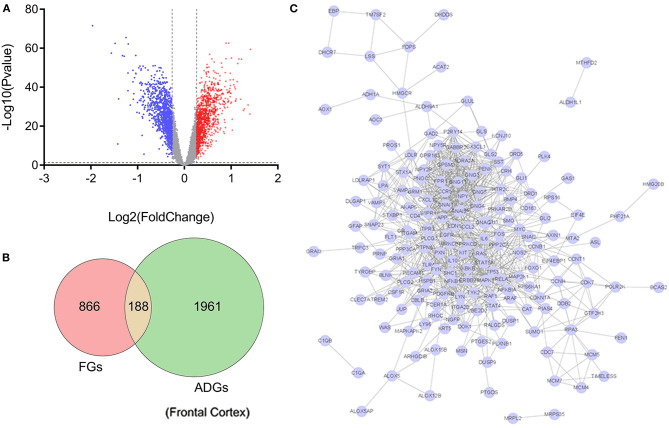
Figure 2.
Pharmacological targets of fingolimod and FGs. (A) Volcano map showing the differentially expressed genes in the frontal cortices of AD patients compared to normal controls. Significantly upregulated genes are shown in red, significantly downregulated genes are shown in blue, and unchanged genes are shown in gray. (B) Venn diagram showing FGs, ADGs, and F-ADGs. (C) PPI networks of F-ADGs. Each node represents an F-ADG.

