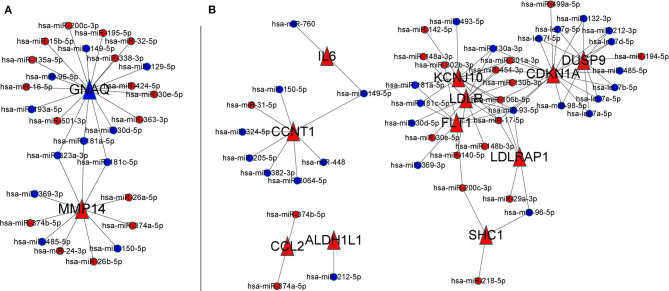
Figure 8.
Severity-related F-ADG-miRNAs (A) AD patients with MMSE score 0–27 group, (B) mild or moderate dementia AD patients subgroup (MMSE score 11–22). The red dots indicate miRNAs that are upregulated in late AD; the blue dots indicate miRNAs that are downregulated in late AD; and the red triangle indicates the mRNA that is upregulated with the worsening of AD.

