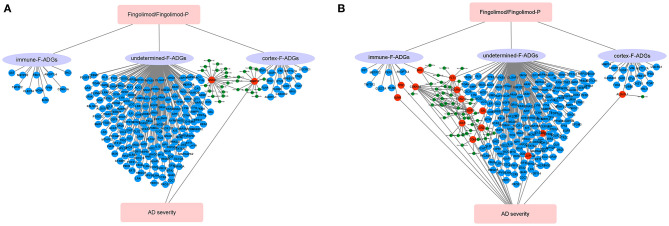
Figure 9.
Schematic diagram of the synaptic action of fingolimod in AD patients. (A) AD patients with MMSE score 0-27 group, (B) mild or moderate dementia AD patients subgroup (MMSE score 11-22). The red circles represent F-ADGs that are related to the severity of AD; the blue circles represent F-ADGs that are not related to the severity of AD; and the green circles represent miRNAs.

