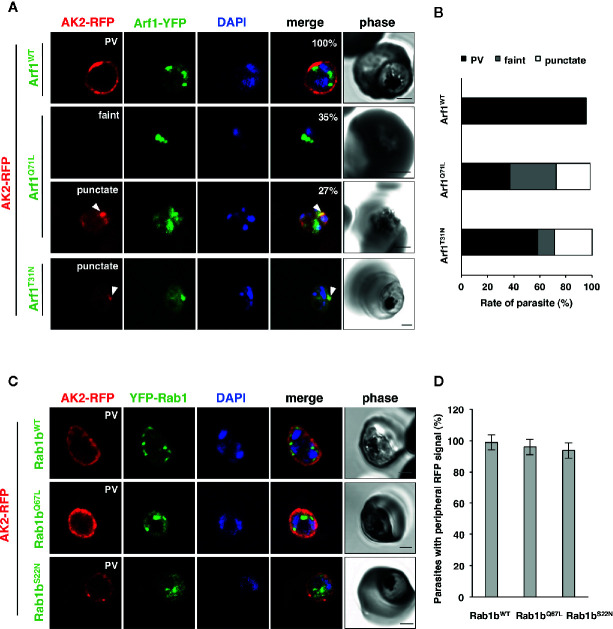
Figure 5.
The specific role of PfArf1 in the transport of N-acylated PfAK2 to the PVM. Parasites expressing PfAK2-RFP and PfArf1-YFP-DD (A, B) or DD-YFP-PfRab1b (C, D) were examined using the immunofluorescence assay. Fluorescence signals from RFP (red), YFP (green), and DAPI (blue) are shown. Wild-type PfArf1 or PfRab1b (upper panels), the active mutant PfArf1Q71L or PfRab1bQ67L (middle panels), and the inactive mutant PfArf1T31N or PfRab1bS22N (lower panels) are shown. Representative images for PfAK2-RFP are shown and are divided into three patterns: peripheral PVM staining (PVM), faint signal (faint), and dot-like punctate signal within the parasites (punctate). The bars indicate 2 µm. The parasites that showed a signal for PfAK2-RFP were classified into three patterns based on the PfArf1-RFP expressing cells (B) and then shown in bar graph. The rate of parasites showing peripheral staining for PfAK2-RFP in RFP-PfRab1b expressing cells (D). Thirty individual early trophozoites and early schizonts were counted from three independent experiments. Infected RBCs, recognized by the DAPI and YFP signals under the microscope, were imaged by the laser microcopy, and then analyzed for the localization of RFP signal as PV, faint, and punctate. The statistical significance was determined using the Student’s t-test.

