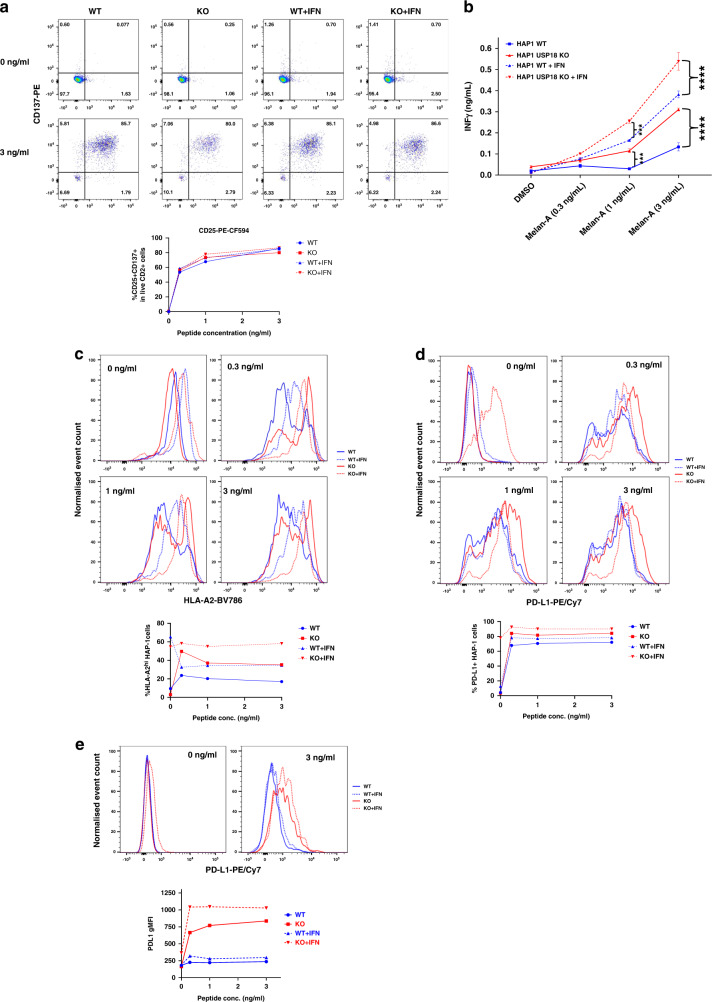
Fig. 5. USP18 regulates major histocompatibility complex class I (MHC-I) antigen presentation, PD-L1 expression and stimulation of a T cell response.
Wild-type or USP18-deficient HAP1 cells were pre-treated with or without IFN-a, then pulsed with Melan-A26-35 peptide at the indicated concentrations and co-cultured with Melan-A-specific T cells. a Upregulation of activation markers on T cells was assessed by flow cytometry. Dotplots show representative examples of CD25 and CD137 expression on live CD2+ cells (T cells) following co-culture with the indicated peptide-pulsed HAP1 cells and the proportion of T cells expressing both CD25 and CD137 is plotted below. b T cell release of IFNy into HAP1-T cell co-culture supernatants was measured by ELISA. Bars show mean values from 3 replicates and for the statistical analysis, we applied two-way ANOVA tests, including multiple comparison testing via the Dunnett method available through the GraphPad Prism software. P value style is GraphPad: NS, P = 0.1234, *P = 0.0332, **P = 0.0021, ***P = 0.0002, ****P < 0.0001. Expression of c HLA-A2 and d PD-L1 on HAP1 cells following co-culture with T cells was measured by flow cytometry. Histogram plots of the data are shown above, and the plots below show the percentage of cells (c) expressing high levels of HLA-A2 (defined as greater than those expressed on non-peptide-pulsed cells not pre-treated with type 1 IFN and (d) expressing PD-L1. e PD-L1 expression on T cells following co-culture with the indicated HAP1 cells. Representative histogram plots are shown above, and the geometric mean fluorescence intensity (gMFI) of PD-L1 expression on T cells from each co-culture condition is plotted below. The results shown in this figure are representative of data from 1 of 3 experiments and the FACS shows information of three replicates pooled into one. Event counts on histogram plots have been normalised to unit area to enable comparison between samples.

