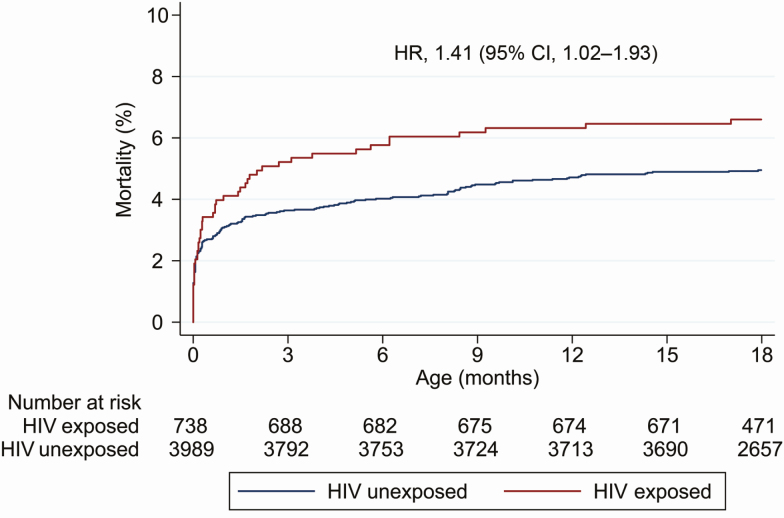
Figure 1.
Cumulative hazard curves for mortality through 18 months. Kaplan-Meier curves are shown for children who were human immunodeficiency virus (HIV) exposed and children who were HIV unexposed. Hazard ratios were estimated by Cox regression analysis accounting for within-cluster correlation and adjusted for trial arm. Plot halted at 18 months. Abbreviations: CI, confidence interval; HIV, human immunodeficiency virus; HR, hazard ratio.

