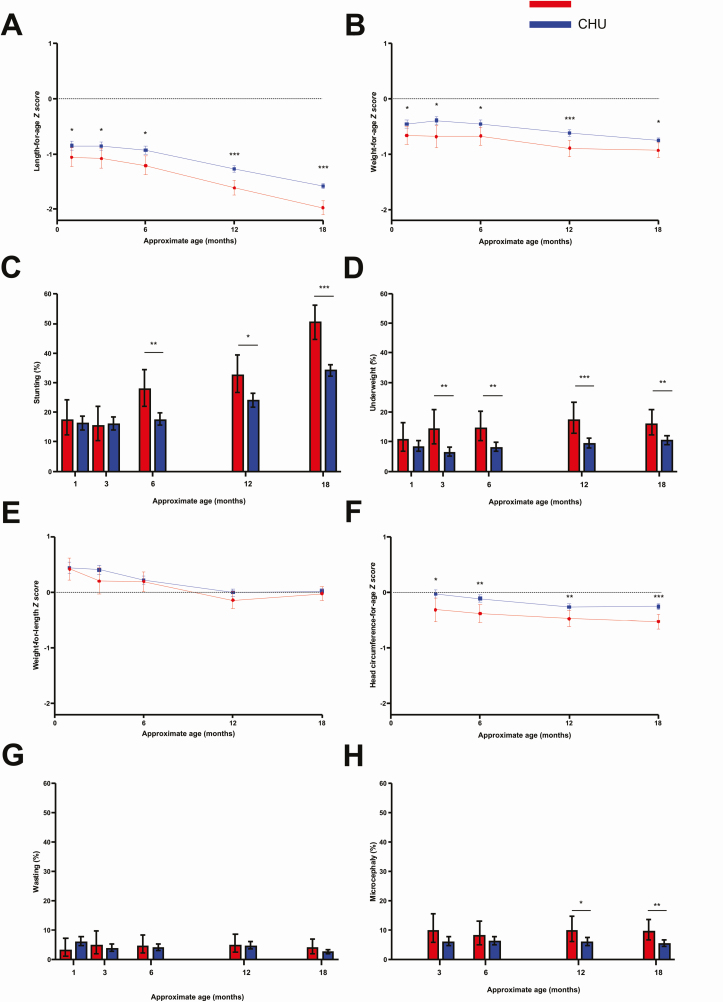
Figure 2.
Growth outcomes of children who were human immunodeficiency virus (HIV) exposed but uninfected (CHEU) and children who were HIV unexposed (CHU) through 18 months of age. Length-for-age (A), weight-for-age (B), weight-for-length (E), and head circumference-for-age (F) z score growth trajectories in CHEU and CHU through 18 months. Data points are z score with 95% confidence intervals (CIs). Stunting (C), underweight (D), wasting (G), and microcephaly (H) in CHEU and CHU through 18 months. Data points are point prevalence percentages with 95% CIs. Number of children (CHEU/CHU) at each timepoint for length-for-age z score (A) and stunting (C): 176/1014 at 1 month, 116/1061 at 3 months, 215/1231 at 6 months, 220/1318 at 12 months, and 297/1771 at 18 months; weight-for-age z score (B) and underweight (D): 175/991 at Figure 2. Continued. 1 month, 160/1049 at 3 months, 217/1216 at 6 months, 221/1308 at 12 months, and 297/1765 at 18 months; weight-for-length (E) and wasting (G): 175/984 at 1 month, 159/1044 at 3 months, 215/1212 at 6 months, 220/1304 at 12 months, and 295/1762 at 18 months; head circumference-for-age z score (F) and microcephaly (H): 169/1038 at 3 months, 214/1232 at 6 months, 221/1321 at 12 months, and 296/1757 at 18 months (there was no head circumference measurement at 1 month of age). Stunting: length-for-age z score < −2; underweight: weight-for-age z score < −2; wasting: weight-for-length z score < −2; microcephaly: head circumference-for-age z score < −2. Only children in non–infant and young child feeding trial arms were included. *P < .05, **P < .01, ***P < .001. Full details including CIs appear in Supplementary Table 5.

