FIGURE 6.
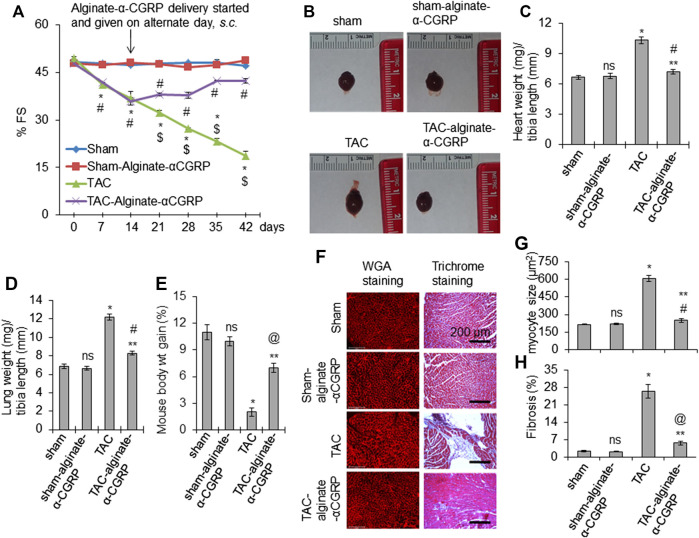
Alginate-α-CGRP microcapsule administration in 15-days post-TAC mice improves cardiac functions. (A) Graph showing % FS in sham, sham-alginate-α-CGRP, TAC-only, and TAC-alginate-α-CGRP groups of mice. After 15 days of TAC, alginate-α-CGRP microcapsules containing α-CGRP doses of 6 mg/kg/mouse were injected on alternate days, until day 28. Echocardiography was performed at different time points and % FS was plotted as mean ± SEM. *p < 0.05, TAC vs sham at the same time point; #p < 0.05, TAC-alginate-α-CGRP vs sham at the same time point; $p < 0.05, TAC vs TAC-alginate-α-CGRP at the same time point. (B) Representative images showing the size of hearts after 28 days of delivery of alginate-α-CGRP microcapsules. Ratio of wet heart weight/tibia length was plotted as mean ± SEM (C). (D) Bar diagram showing ratio of wet lung weight/tibia length as mean ± SEM. (E) Bar diagram showing mice weight gain (in percentage) during the course of the experiment as mean ± SEM. p < 0.05 was considered significant. *p < 0.05, TAC vs sham; **p < 0.05, TAC-alginate-α-CGRP vs TAC; #p > 0.05, TAC-alginate-α-CGRP vs sham; @ p < 0.05, TAC-alginate-α-CGRP vs sham; ns, not-significant compared to sham. (F) Representative histology images showing the size of cardiomyocytes (WGA staining) and level of fibrosis (trichrome-collagen staining) in the LVs from different groups of mice. Cardiomyocyte size (G) and % fibrosis (H) in LVs were quantitated using the NIH-ImageJ software and plotted as mean ± SEM. p value <0.05 was considered significant. *p < 0.05, TAC vs sham; **p < 0.05, TAC-alginate-α-CGRP vs TAC; #p > 0.05, TAC-alginate-α-CGRP vs sham; @ p < 0.05, TAC-alginate-α-CGRP vs sham; ns = not-significant compared to sham.

