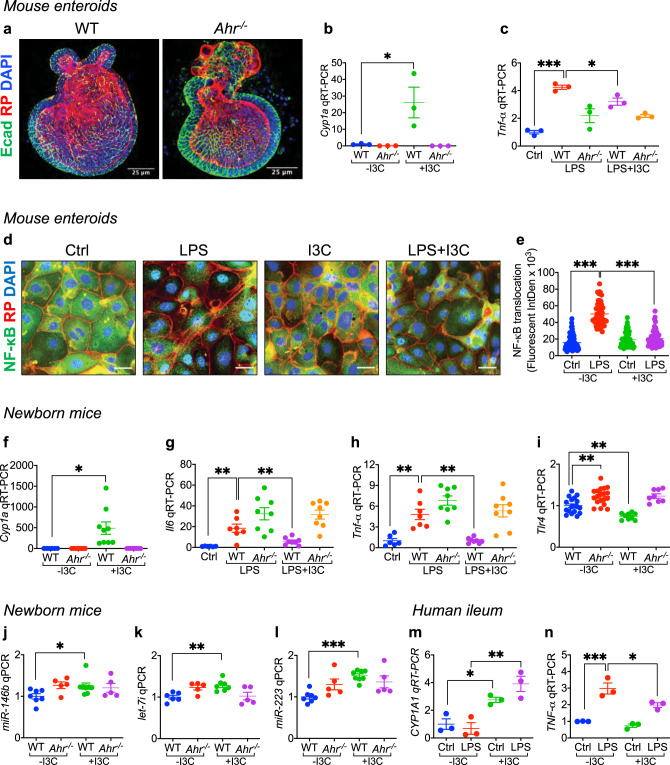
Fig. 4. AHR activation limits TLR4 signaling and expression in the intestinal epithelium of mice and humans.
a Representative confocal images of enteroids harvested from wild-type (WT) and AHR knockout (Ahr-/-) mice after 7 days of culture on Matrigel, and stained with the epithelial marker (Ecadherin, Ecad, green signal), actin filaments (Rhodamine Phalloidin, RP, red signal), and nuclei (DAPI, blue signal). b, c qRT-PCR showing the expression of Cyp1a1 (b, n = 3, 3, 3, 3 wells of enteroids, WT -I3C vs WT + I3C p = 0.0208) and Tnf-α (c, n = 3, 3, 3, 3 wells of enteroids, Ctrl vs WT LPS p < 0.0001, WT LPS vs WT LPS + I3C p = 0.0258) in these enteroids under the indicated condition (200 μM I3C pretreatment overnight and then LPS treatment (50 μg per mL) for 4 h). d, e Representative confocal images (d) and quantification of fluorescent intensity of NF-κB translocation (e, n = 81, 48, 48, 50 enteroid cells, Ctrl -I3C vs LPS -I3C p < 0.0001, LPS -I3C vs LPS + I3C p < 0.0001). NF-κB, green signal; actin filaments (Rhodamine Phalloidin, RP, red signal); nuclei (DAPI, blue signal). f–i qRT-PCR showing the expression of Cyp1a1 (f, n = 6, 8, 9, 8 mice, WT -I3C vs WT + I3C p = 0.0042), Il6 (g, n = 6, 7, 8, 8, 8 mice, Ctrl vs WT LPS p = 0.0018, WT LPS vs WT LPS + I3C p = 0.0065), Tnf-α (h, n = 6, 7, 8, 8, 8 mice, Ctrl vs WT LPS p = 0.0036, WT LPS vs WT LPS + I3C p = 0.0017) and Tlr4 (i, n = 18, 19, 9, 8 mice, WT -I3C vs Ahr-/- -I3C p = 0.0013, WT -I3C vs WT + I3C p = 0.0033) in the ileum of newborn mice after treatment with or without I3C (25 mg per kg body weight per day for 4 days). j, k qRT-PCR showing the expression of the Tlr4 regulatory microRNAs, miR-146b (j, n = 7, 5, 8, 5 mice WT -I3C vs WT + I3C p = 0.0300), let-7i (k, n = 6, 5, 7, 5 mice WT -I3C vs WT + I3C p = 0.0016) and miR-223 (l, n = 7, 5, 8, 5 mice WT -I3C vs WT + I3C p < 0.0001) in the ileum of WT and Ahr-/- mice in the presence or absence of I3C (25 mg per kg body weight for 24 h). m, n qRT-PCR showing expression of CYP1A1 (m, n = 3, 3, 3, 3 wells of human explant culture, Ctrl -I3C vs Ctrl +I3C p = 0.0147, LPS -I3C vs LPS + I3C p = 0.0096) and TNF-α (n, n = 3, 3, 3, 3 wells of human explant culture, Ctrl -I3C vs LPS -I3C p = 0.0003, LPS -I3C vs LPS + I3C p = 0.0218) in the presence of I3C (200 μM I3C pretreatment for 15 min and then additional 6 h) and LPS (50 μg per mL for 6 h). Scale bars in a, 25 μm. Scale bars in d, 10 μm. All data are presented as mean values ± SEM. *p < 0.05, **p < 0.01, ***p < 0.001, p values obtained either from two-sided t tests or one-way ANOVA followed by multiple comparisons. Each dot in graphs represents data from an individual well of enteroids culture, an individual enteorid cell of NF-κB staining, an individual mouse, or an individual well of human explant culture.

