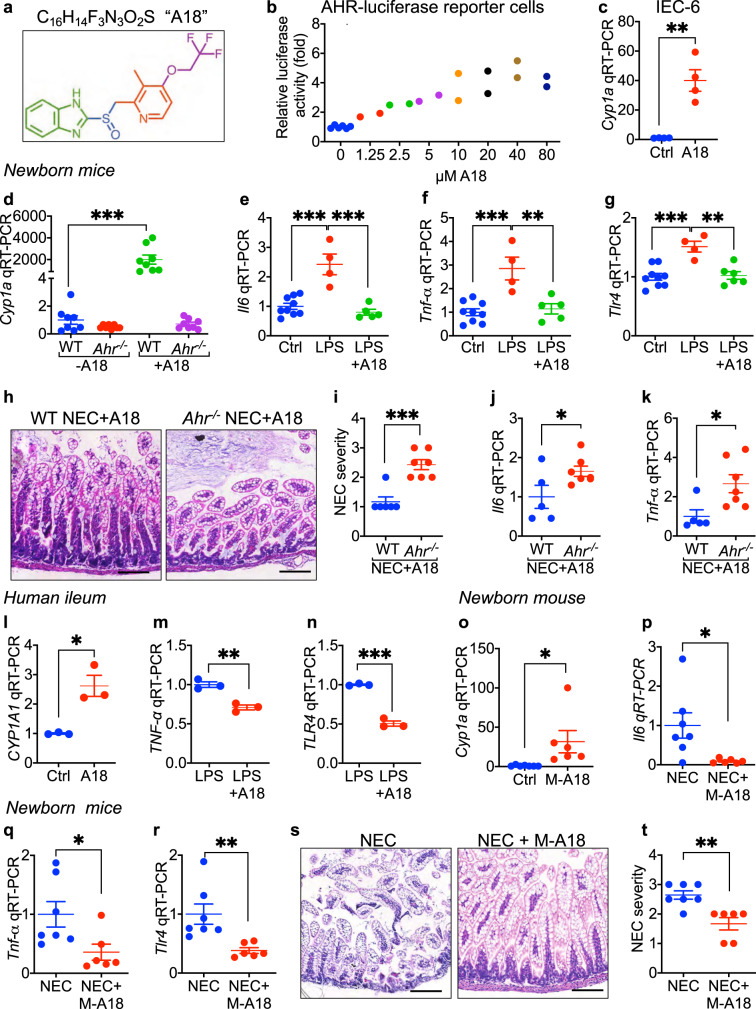
Fig. 6. The AHR agonist “A18” activates AHR on the intestinal epithelium, reduces TLR4 signaling, and protects against experimental NEC in newborn mice.
a Molecular formula of A18. b Dose-response curve of A18 for luciferase activity in AHR-reporter IEC-6 cells (n = 6, 2, 2, 2, 2, 2, 2, 2 wells of cells, 0 vs 2.5 p = 0.0390, 0 vs 5 p = 0.0081, 0 vs 10 p = 0.0006,). c qRT-PCR showing expression of Cyp1a1 in IEC-6 cells treated with A18 (20 μM for 6 h) (n = 4, 4, wells of cells, p = 0.0018). d–g qRT-PCR showing expression of Cyp1a1 (d, n = 8, 8, 8, 8 mice, WT - A18 vs WT + A18 p < 0.0001), Il6 (e, n = 9, 4, 5 mice, Ctrl vs LPS p < 0.0001, LPS vs LPS + A18 p < 0.0001), Tnf-α (f, n = 9, 4, 5 mice, Ctrl vs LPS p = 0.0003, LPS vs LPS + A18 p = 0.0017) and Tlr4 (g, n = 9, 4, 5 mice, Ctrl vs LPS p = 0.0004, LPS vs LPS + A18 p = 0.0011) in the ileum of wild-type (WT) but not AHR knockout (Ahr-/-) mice. h–k Representative histological H&E of the terminal ileum (h), NEC severity score (i, n = 6, 7 mice, p = 0.0003), expression of Il6 (j, n = 5, 7 mice, p = 0.0484) and Tnf-α (k, n = 5, 7 mice, p = 0.0222) in newborn mice with NEC after administration of A18 (300 mg per kg body weight per day for 4 days). l–n qRT-PCR showing expression of CYP1A1 (l, n = 3, 3 wells of human explant culture, p = 0.0106), TNF-α (m, n = 3, 3 wells of human explant culture, p = 0.0035) and TLR4 (n, n = 3, 3 wells of human explant culture, p = 0.0001) in freshly harvested human ileum obtained at surgery treated with LPS (50 μg/mL for 6 h) and/or A18 (20 μM A18 pretreatment for 15 min and then additional 6 h). o–t qRT-PCR showing expression Cyp1a1 (o, n = 7, 6 mice, p = 0.0377) in the neonatal ileum after maternal administration of A18 (300 mg per kg body weight per day for 4 days), expression of Il6 (p, n = 7, 6 mice, p = 0.0254), Tnf-α (q, n = 7, 6 mice, p = 0.0346) and Tlr4 (r, n = 7, 6 mice, p = 0.0081), ileal H&E of the newborn (s) and NEC severity (t, n = 7, 6 mice, p = 0.0023) after NEC induction in the absence or presence of maternal A18 (M-A18, 300 mg per kg body weight per day for 4 days). Scale bars in h, s, 100 μm. All data are presented as mean values ± SEM. *p < 0.05, **p < 0.01, ***p < 0.001, p values obtained either from two-sided t tests or using one-way ANOVA followed by multiple comparisons. Each dot in graphs represents data from an individual of cell culture, an individual mouse, or an individual well of human explant culture.

