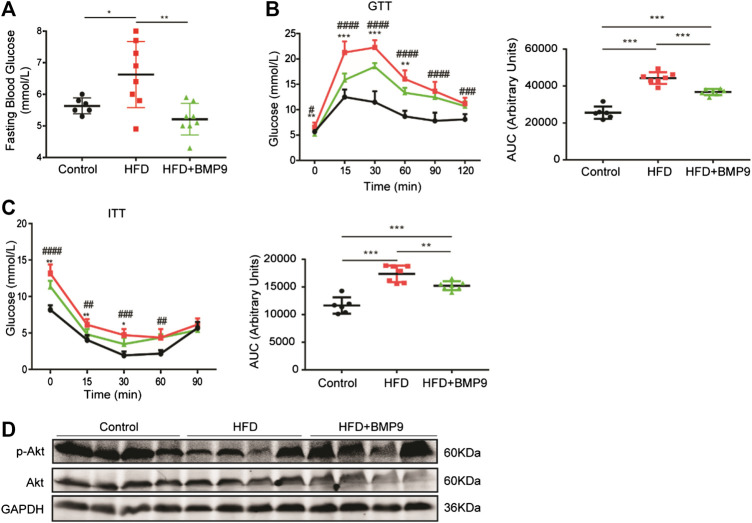
FIGURE 4.
BMP9 modulates glucose metabolism in HFD-induced fatty livers in mice. (A) Fasting Blood Glucose levels in different groups (Control n = 6; HFD n = 8, HFD+BMP9 n = 8). (B) Blood glucose levels and the area under the curve for glucose during GTT (Control n = 6; HFD n = 7, HFD+BMP9 n = 7). (C) Blood glucose levels and the area under the curve for glucose during ITT (Control n = 6; HFD n = 7, HFD+BMP9 n = 7). (D) The level of p-Akt in the livers of mice. The data are expressed as the means ± SEM. *p < 0.05, **p < 0.01, ***p < 0.001, ## p < 0.01, ### p < 0.001, #### p < 0.0001.* HFD vs. HFD+BMP9, #HFD vs. Control.

