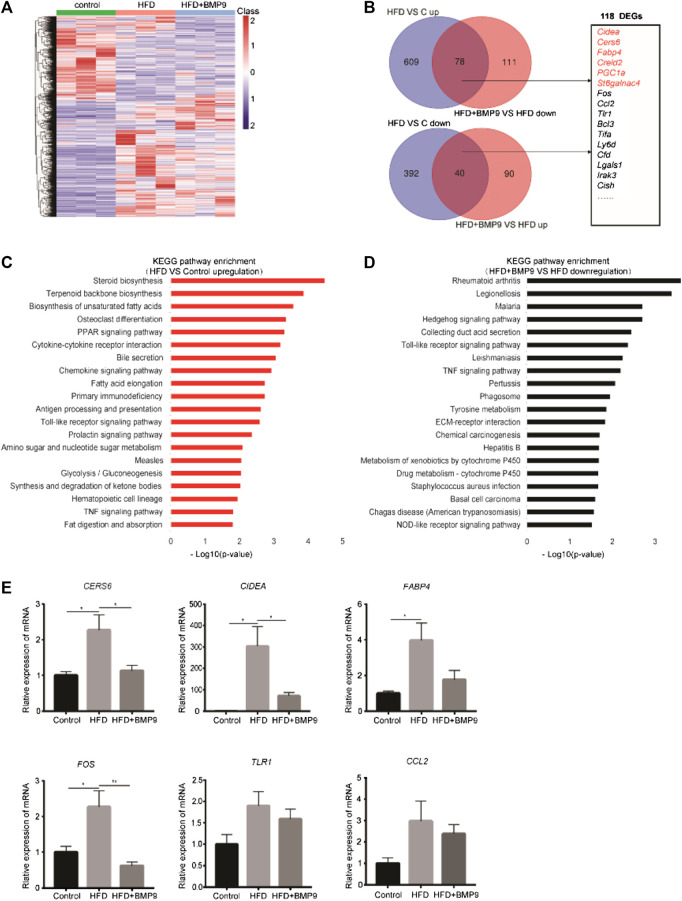
FIGURE 5.
BMP9 reprogrammes transcriptional profiles of HFD-fed mouse livers. (A) Hierarchical cluster analysis of all DEGs in the three groups, n = 3 in each group. p < 0.05, |Log2FC|>1. (B) DEGs with opposite trends in HFD vs Control and HFD+BMP9 vs. HFD, and sixteen DEGs associated with lipid metabolism and inflammation are listed. p < 0.05, |Log2FC|>1. (C) KEGG (Kyoto Encyclopedia of Genes and Genomes) annotation for the upregulated genes between the HFD and Control groups. (D) KEGG annotation for the downregulated DEGs between the HFD+BMP9 and HFD groups. (E) Validation of some DEGs by qRT-PCR in mouse livers. The data are expressed as the means ± SEM. *p < 0.05, **p < 0.01.

