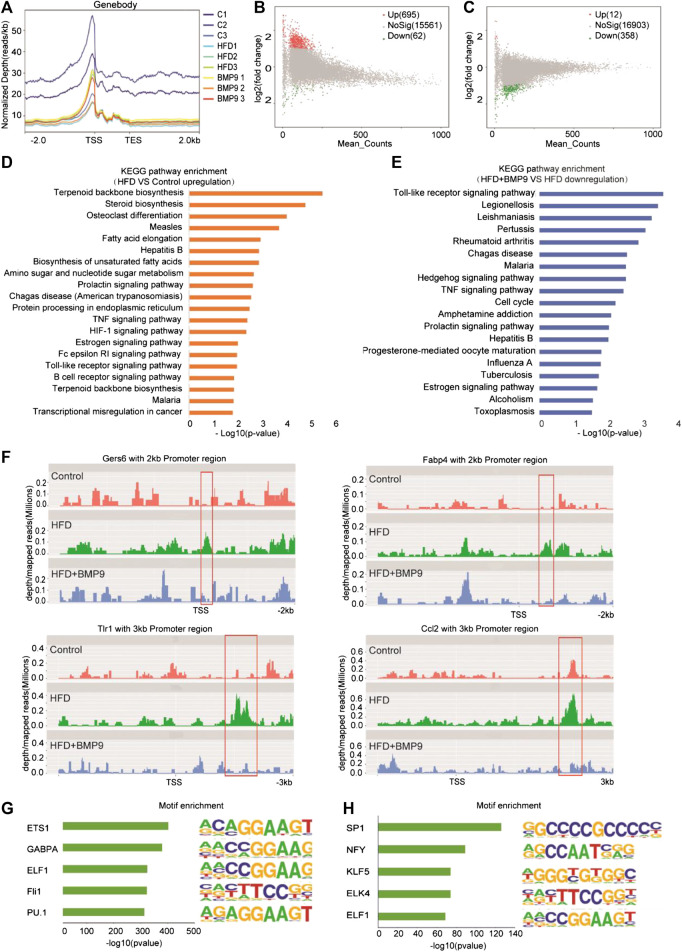
FIGURE 6.
BMP9 changes the chromatin accessibility of HFD-fed mice. (A) Chromatin accessibility around the TSS in Control, HFD and BMP9-treated HFD mice. n = 3 in each group. (B) and (C) Scatter plot of the accessibility at each peak in the different groups. (B) HFD vs. Control and (C) HFD+BMP9 vs. HFD. The red points represent upregulation, and green points represent downregulation. TES: Transcription end site; TSS: Transcription start site. (D) and (E) Histogram of KEGG (Kyoto Encyclopedia of Genes and Genomes) annotation for the genes with trends in the HFD+BMP9 vs. HFD groups. Orange represents upregulation, and treen represents downregulation. (F) Depth mapped reads analysis show signal levels of Cers6, Fabp4, Ccl2 and Tlr1 with 2–3 kb promoter regions in the different groups. (G) and (H) Motif-enrichment analysis of the downregulated accessible sites and upregulated accessible sites, respectively.

