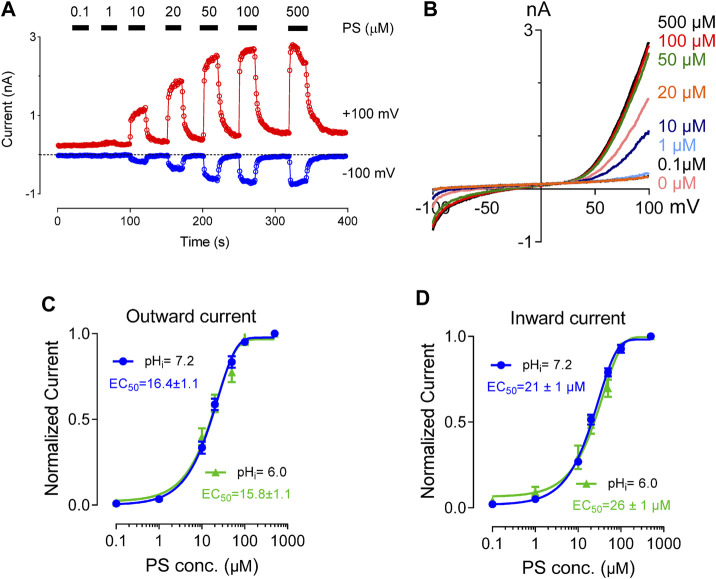
FIGURE 3.
Concentration-response curve for PS-induced currents in hTRPM3, at the indicated intracellular pH. (A) Time course of TRPM3 currents elicited by voltage ramps ranging −100 to +100 mV. PS was applied extracellularly in increasing concentration sequence at concentrations of 0, 0.1, 1, 10, 20, 50, 100, and 500 µM, with an adequate washing period between subsequent PS applications. (B) Representative recording of TRPM3 current at the indicated PS concentration in (A). (C) Outward current normalized to maximum concentration-response (500 µM) of the PS, with error bars showing SEM (n = 7 cells). The EC50 values of PS for the outward currents are 16.4 ± 1.1 µM at pH 7.2 and 15.8 ± 1.1 µM at pH 6.0. (D). Inward current normalized to maximum concentration-response (500 µM) of the PS, with error bars showing SEM (n = 7 cells). The EC50 values of PS for the inward currents are 21.0 ± 1.0 µM at pH 7.2 and 26.0 ± 1.0 µM at pH 6.0.

