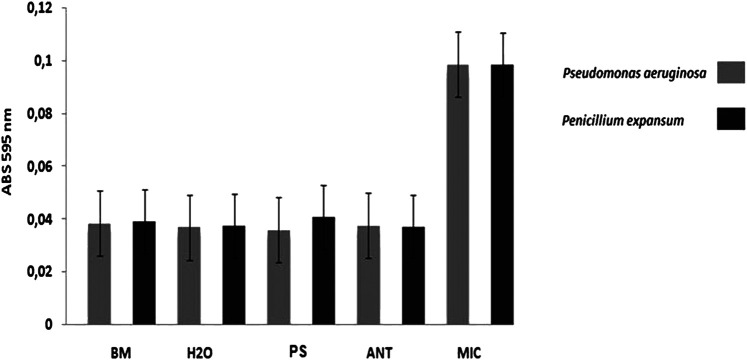
FIGURE 3.
Antimicrobial activity. In the graph it is possible to compare the results of the antimicrobial activity presented by the treatments with the samples in comparison to the controls. Result of antimicrobial assays against Pseudomonas aeruginosa ATCC27853 (MIC 1 –in grey) and Penicillium expansum (MIC2 –in black) by reading absorbance at 595 nm. BM –Broth medium (PB to bacteria and PDB to fungus): 100 μl; H2O –sterile ultrapure water: 100 μl; MIC –microorganism: 20 μl of sterile ultrapure water + culture medium with inoculums; ANT –antibiotics (Tetracycline to bacteriaand Anfotericin B to fungus): 20 μl ofantibiotic (10 mg/ml) + culture medium with inoculums; PS –protein sample (0.3 μM for MIC 1 and 0.15 μM for MIC 2) in sterile ultrapure water: 20 μl of sample +culture medium with inoculums. Obs.: Microorganisms shown in sterile microplates with a lid. The bacteria, being aerobic organisms, were kept under agitation. The incubation period was 18 h for bacteria and 36 h for fungus, at 30°C (Orbital Shaker for Microplates).

