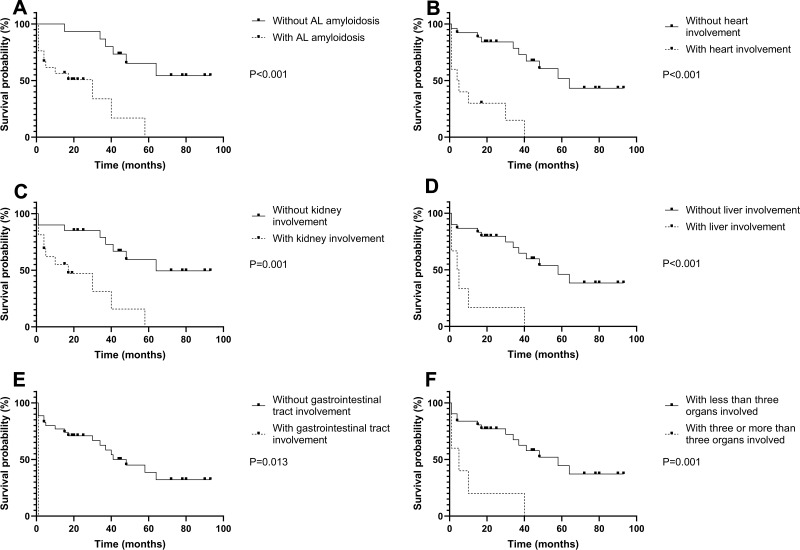
Figure 2.
Kaplan–Meier curves demonstrating the impact of AL amyloidosis on overall survival of smoldering multiple myeloma. (A) Survival difference between patients with and without AL amyloidosis in smoldering multiple myeloma patients. P<0.001. (B) Survival difference between AL patients (in smoldering multiple myeloma patients) with and without heart involvement. P<0.001. (C) Survival difference between AL patients (in smoldering multiple myeloma patients) with and without kidney involvement. P=0.001. (D) Survival difference between AL patients (in smoldering multiple myeloma patients) with and without liver involvement. P<0.001. (E) Survival difference between AL patients (in smoldering multiple myeloma patients) with and without gastrointestinal tract involvement. P=0.013. (F) Survival difference between AL patients (in smoldering multiple myeloma patients) with different number of organ involvement. P=0.001.

