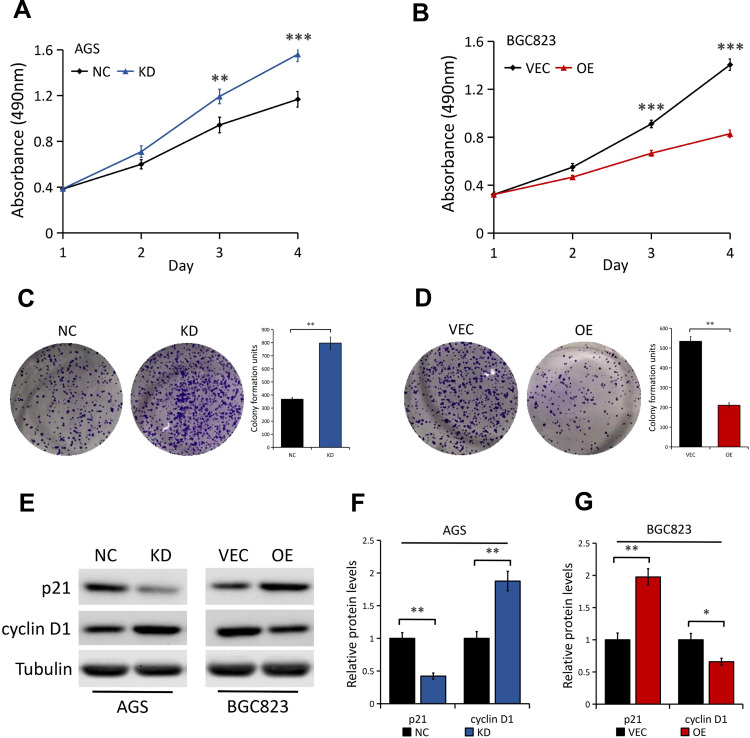
Figure 3.
Effect of DAB2IP expression on GC cell proliferation. (A) MTT assay of AGS cells stably transfected with either control shRNA (NC) or DAB2IP shRNA (KD). (B) MTT assay of BGC823 cells stably transfected with either empty vector (VEC) or plasmids encoding human DAB2IP (OE). (C) Colony formation assay of AGS cells (NC vs KD). The bands were quantified and presented as the mean ± SEM. (D) Colony formation assay of BGC823 cells (VEC vs OE). The bands were quantified and presented as the mean ± SEM. (E–G) Western blot analysis (E) of the indicated proteins in AGS (NC vs KD) and BGC823 (VEC vs OE) cells. Tubulin as a loading control. The bands (F and G) were quantified and presented as the mean ± SEM. **P < 0.01, ***P < 0.001.

