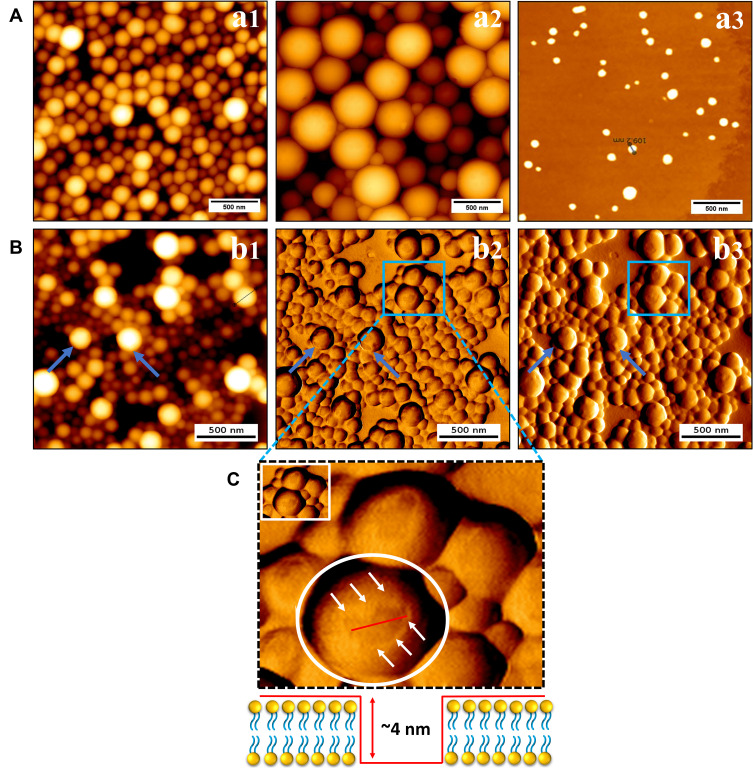
Figure 2.
Illustration of surface morphology of (A): a1) THP NP 200 nm; a2) THP NP 400 nm and a3) mTHPC-LP using AFM. Pane (B) represents the AFM micrographs of lipid-coated nanoparticles b1) height measured view; b2) lock-in amplitude view and b3) lock-in phase view. (C) AFM cross-sectional profile of the lipoparticles demonstrating the lipid thickness around the PLGA nanoparticles. HQ:NSC14/AL_BS cantilevers tips were used for the liposomes while HQ: NSC16/AL_BS were used for the uncoated and coated nanoparticles. The scale bar represents 500 nm scale.

