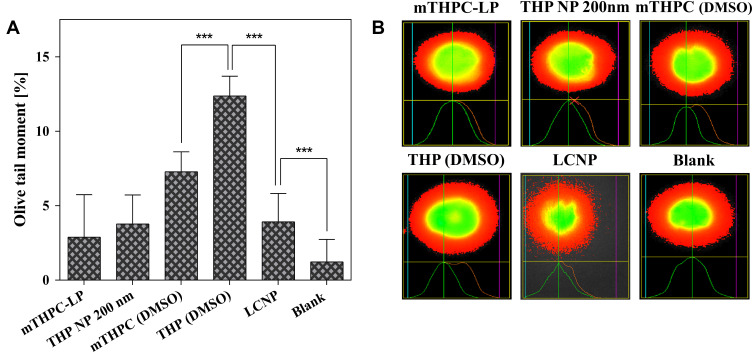
Figure 8.
(A) Distribution of comet tail and (B) fluorescence micrographs of genotoxicity to SK-OV-3 cells obtained from alkaline comet assay. The cells were incubated with mTHPC loaded liposomes, THP loaded PLGA nanoparticles (200 nm), LCNP, and free mTHPC/free THP (dissolved in 0.10% DMSO) for 4 h at an equitoxic dose. Irradiation was performed at a light dose of 0.05 Jcm−2. Each value is represented as the mean ± S.D for three independent experiments. For the statistical analysis, the comparison was done against the untreated cells. P values (p < 0.05) were considered significant and expressed as ***p< 0.001.

