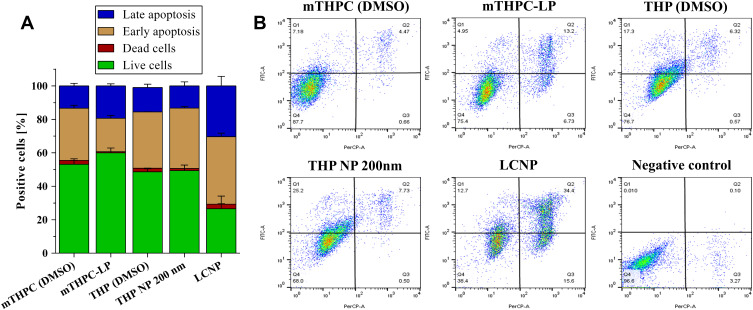
Figure 10.
(A) Graphical representation (B) FACS micrographs of apoptosis assay by flow cytometry in SK-OV-3 cell line by nanoformulations (mTHPC-LP, THP NP 200 nm, and LCNP) as well as with free drugs (mTHPC/THP; dissolved in DMSO). Graphical representation of % positive cells are described as; top left (Q1) = early apoptotic cells, top right (Q2) = late apoptotic cells, bottom right (Q3) = dead cells, and bottom left (Q4) = the healthy cells. The cells irradiated with equivalent light dose and without any treatment were considered as the negative control.

