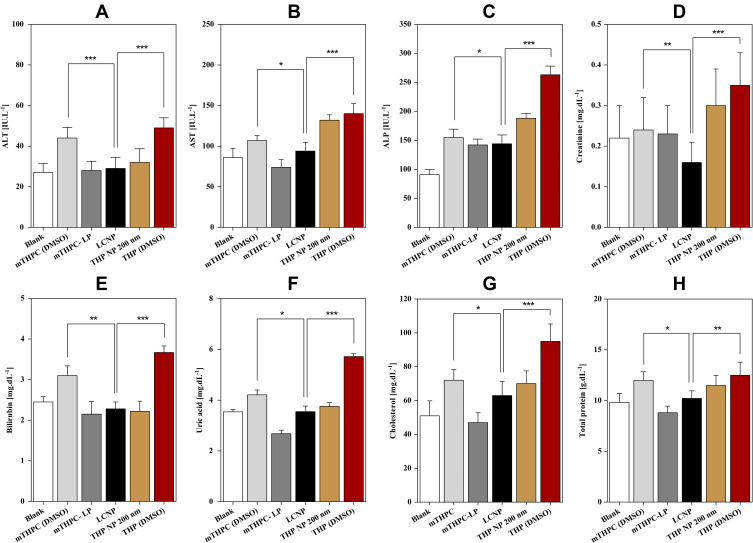
Figure 12.
Typical blood biochemical profile including liver function tests (LFTs); (A) ALT, (B) AST, (C) ALP, (D) creatinine, renal function tests (RFTs); (E) bilirubin, (F) uric acid, as well as (G) cholesterol and (H) total protein levels after being treated with the nanoformulations intravenously. Values are represented as mean ± S.D (n=3) and statistical significance is indicated as ***p < 0.001, **p< 0.01 and *p< 0.1.

