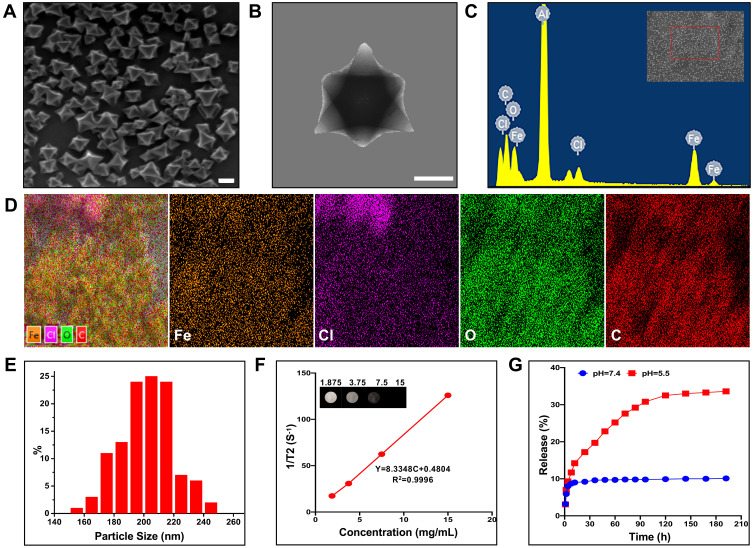
Figure 2.
Characterization of MIL-101(Fe) NPs. (A) SEM and (B) TEM images of MIL-101(Fe) NPs (scale bar: 100 nm). (C) EDS spectrum and (D) element mappings of MIL-101(Fe)NPs. (E) Particle size distribution of MIL-101(Fe) NPs. (F) A plot of relaxation rate 1/T2 versus concentration of MIL-101(Fe) NPs using a MRI scanner; T2 MRI of diverse MIL-101(Fe) NPs concentrations in vitro (inset). (G) Sorafenib release profiles of MIL-101(Fe)@sor NPs at different pH values (5.5 and 7.4).

