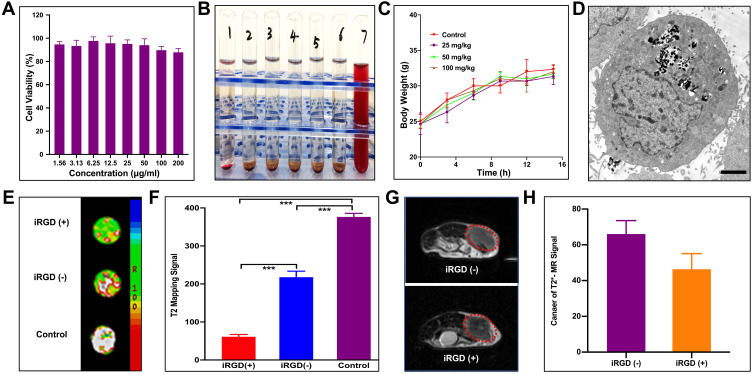
Figure 3.
Toxicity and absorption of MIL-101(Fe) NPs in vitro and in vivo. (A) Viability of HepG2 cells treated with various concentrations of MIL-101(Fe) NPs for 24 h. (B) Photograph of hemolysis samples for MIL-101(Fe)@sor. Tube 1: negative control (NS), Tubes 2–6: five different concentrations MIL-101(Fe)@sor from low to high, Tube 7: positive control. (C) Change in body weights of mice injected with various concentrations of MIL-101(Fe) NPs for 15 days. (D) TEM images of HepG2 cells treated with MIL-101(Fe)@sor. (E) MR images and (F) quantized MR signal intensity of HepG2 cells treated with DMEM, MIL-101(Fe) @sor, or MIL-101(Fe)@sor + iRGD. (G) MR images and (H) quantized MR signal intensity of H22 liver tumors injected with MIL-101(Fe) NPs or MIL-101(Fe) NPs + iRGD. The red circle indicates the tumor.

