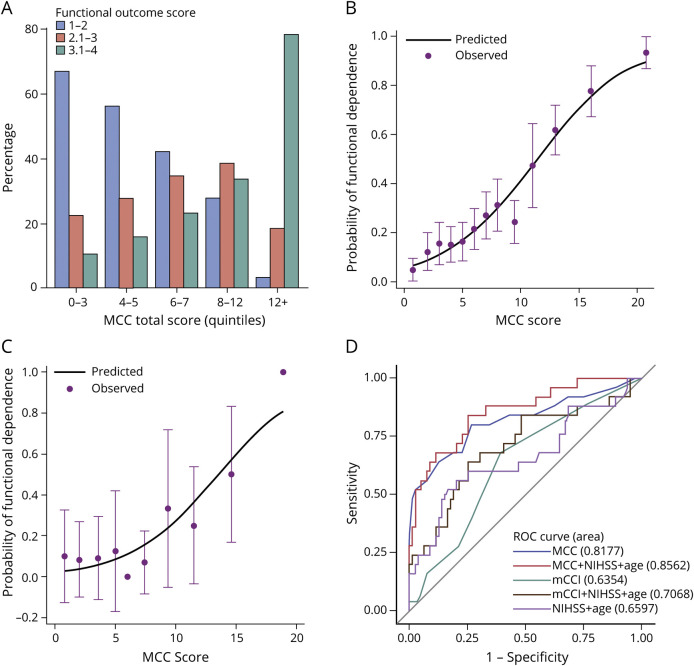
Figure 3. Discrimination and Calibration.
(A) The proportions of patients in each functional outcome score levels by MCC index quintiles. Observed vs predicted proportion of functional dependency (functional outcome score >3) at 90 days in the training (B) and validation (C) dataset are shown. Dots represent the actual proportion of patients being functionally dependent. Vertical lines represent 95% confidence intervals of the actual proportion of patients being functionally dependent. The continuous lines represent the predicted probability of being functionally dependent in the training (B) and validation (C) datasets. (D) Receiver operating characteristic (ROC) curves for models predicting functional outcome at 90 days in the validation dataset. MCC = the new MCC index; mCCI = modified Charlson Comorbidity Index; mRS = modified Rankin Scale; NIHSS = NIH Stroke Scale.

