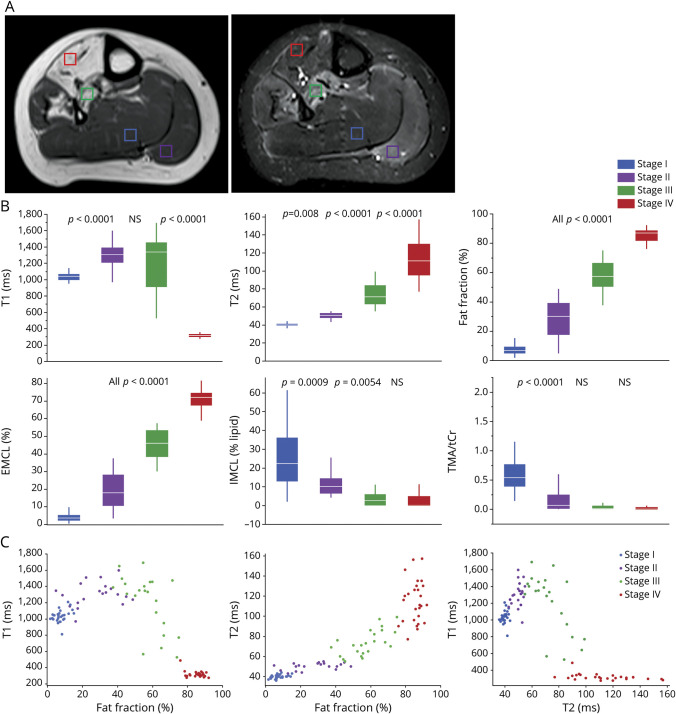
Figure 3. MRI Stages of Muscle Involvement.
(A) Muscle regions representative of stages of muscle involvement as seen on T1-weighted (T1W) and short tau inversion recovery (STIR) images of the lower leg: stage I: soleus muscle with no visible abnormalities on T1W or STIR images (blue voxel); stage II: gastrocnemius muscle showing STIR hyperintensity muscle and no fat infiltration (purple voxel); stage III: posterior tibialis muscle with fat infiltration and STIR hyperintensity (green voxel); stage IV: complete fat replacement of the anterior tibialis (red voxel). (B) Comparison of different MRI and proton magnetic resonance spectroscopy measures by stage. Boxes represent mean, whiskers show SD. p Values of the difference between contiguous stages are shown. (C) T1 and T2 plotted as a function of fat fraction and T1 plotted as a function of T2 are shown for each stage of muscle involvement. Cr = total creatine; EMCL = extramyocellular lipid; IMCL = intramyocellular lipid; TMA = trimethylamines.

