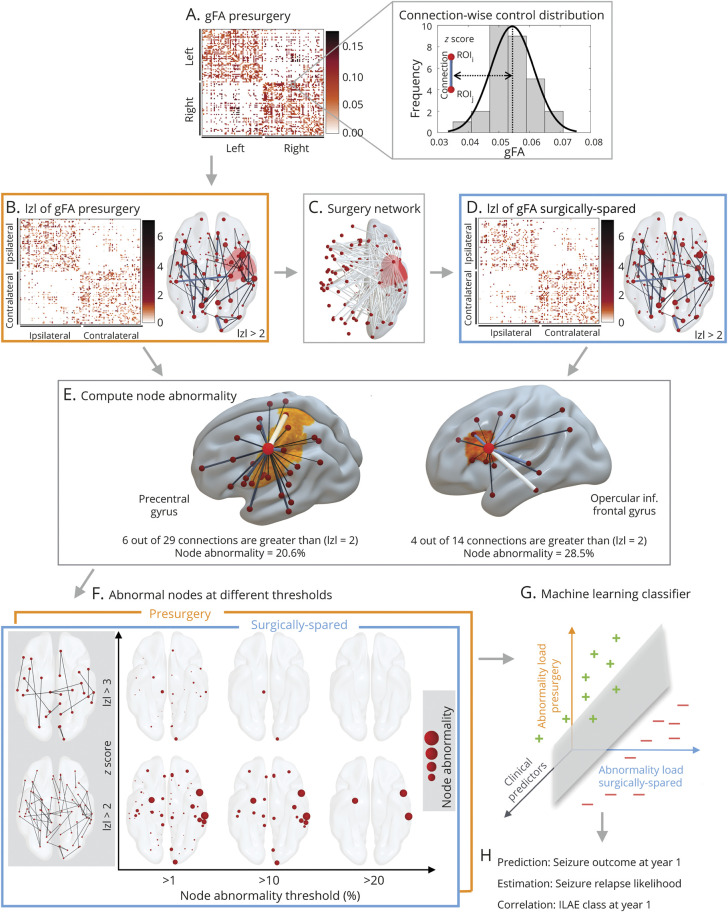
Figure 2. Overall Pipeline.
Presurgical generalized fractional anisotropy (gFA) network architecture for each patient in panel (A) is inferred, and connections between regions of interest are standardized against a control distribution (illustrated for an example connection in the right of panel [A]) to obtain a z score–transformed network in panel (B). The connections affected by the surgery shown in surgery network in panel (C) are removed to obtain surgically spared network in panel (D). (E) Concept of node abnormality for 2 example nodes. By normalizing the number of abnormal links to a node with its degree, the heterogeneity in the degree of network nodes is accounted for. An h-degree node can be less abnormal compared to a low-degree node depending on the number of abnormal connections. (F) Different thresholds required for the computation of node abnormality are shown for surgically spared network (blue panel front) and the presurgery network (orange panel back). The z score at which a link is considered abnormal is on the y-axis, and the cutoff at which a node is considered abnormal is shown on the x-axis. (G and H) Abnormality loads in presurgery and surgically spared networks are incorporated into a machine learning classifier along with the clinical predictors to predict seizure outcomes at year 1 both in terms of binary seizure-free (plus in green) vs not seizure-free (minus in red) outcome and in terms of the probability with which each patient was classified as not seizure-free. These probabilities correlated with severity of seizure outcome (i.e., International League Against Epilepsy [ILAE] class) at year 1 and associated with the seizure relapse in 5 years. We called these probabilities predicted seizure relapse likelihood. |z| = z-score

