Figure 3.

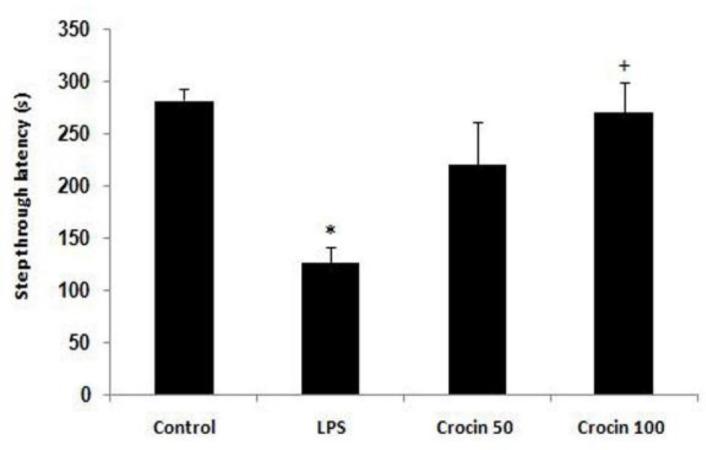
Step-through latency in the control and LPS-treated rats. Data are shown as mean±SEM for ten animals in each group. *p<0.05 vs control group, and +p<0.05 vs LPS group

Step-through latency in the control and LPS-treated rats. Data are shown as mean±SEM for ten animals in each group. *p<0.05 vs control group, and +p<0.05 vs LPS group