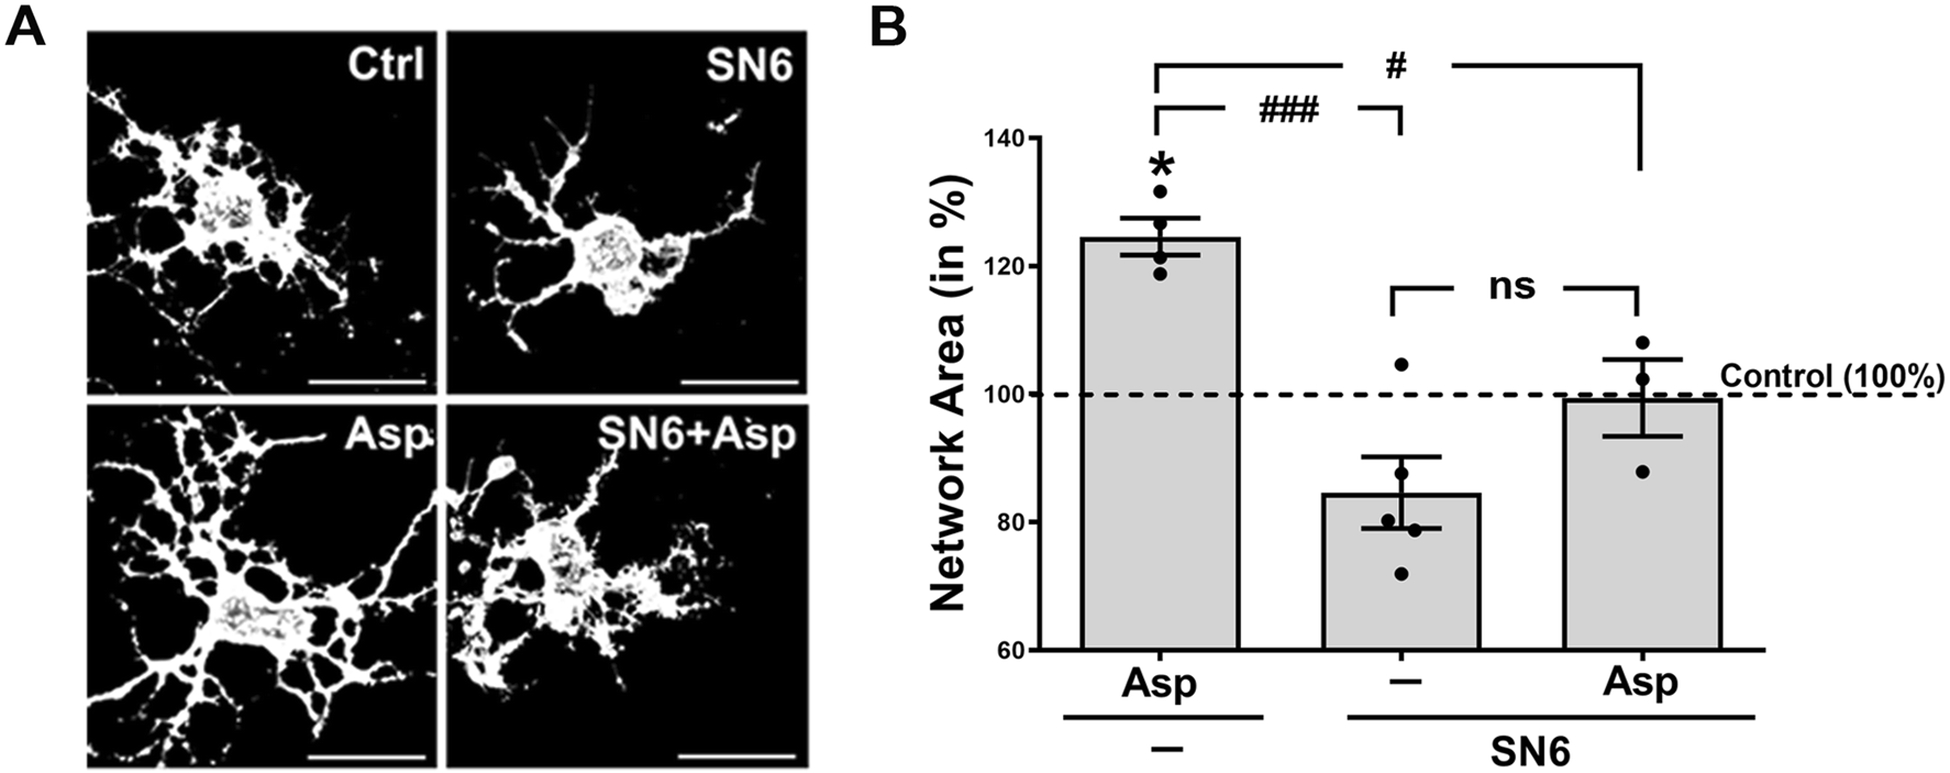
Fig. 2. Inhibition of the reverse mode of Na+/Ca2+ exchange attenuates glutamate transporter stimulated morphological maturation of oligodendrocytes.

Cells were treated for 6h as indicated. Asp (D-Asp, 100 μM), SN6 (a selective inhibitor of Na+/Ca2+ exchange (reverse mode), 10 μM). A: Representative images of differentiating oligodendrocytes after immunostaining with O4 hybridoma supernatants. Scale bars: 20 μm. B: Graph depicting network areas. The mean values for control (non-treated) cells were set to 100% (dotted horizonal line) and experimental values were calculated accordingly. Dots represent individual experiments, horizontal lines indicate means, error bars are depicted as SEM. *p≤0.05 (compared to control; one sample t-test); #p≤0.05, ###p≤0.001, nsnot significant (ANOVA, Tukey’s multiple comparison test)
