Figure 2.
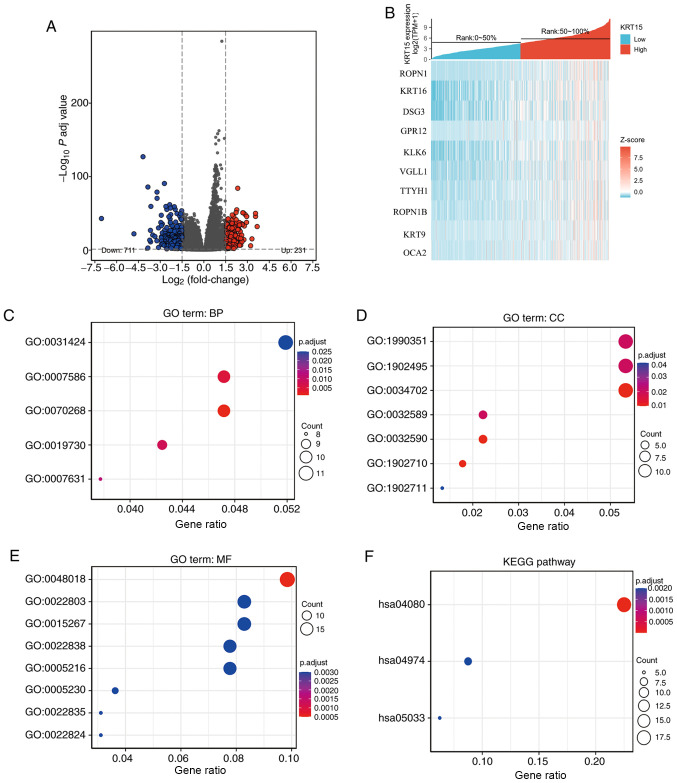
Functional enrichment analysis for KRT15-associated genes in BRCA. (A) Volcano plot depicting the differentially expressed genes (|log fold change|>1.5; P<0.05) between the high and low gene expression groups. Blue represents downregulation and red upregulation. (B) Heatmap of the top differentially expressed genes in the BRCA dataset. The x-axis represents the samples and the y-axis represents the DEGs. (C-F) Bubble charts presenting significantly enriched terms of the DEGs in the GO categories (C) BP, (D) CC and (E) MF and (F) KEGG pathways. Enrichment analysis was performed based on a P adj <0.05. BRCA, breast invasive carcinoma; KRT15, keratin 15; FC, fold change; P adj, adjusted P-value; DEG, differentially expressed gene; TPM, transcripts per million reads; ROPN1, ropporin-1; KRT16, keratin16; DSG3, desmoglein-3; GPR12, G-protein coupled receptor 12; KLK6, kallikrein-6; VGLL1, vestigial-like protein 1; TTYH1, tweety homolog 1; KRT9, keratin 9; OCA2, oculocutaneous albinism II; GO, Gene Ontology; KEGG, Kyoto Encyclopedia of Genes and Genomes; BP, biological process; CC, cellular component; MF, molecular function.

